

- Eazybe Last Broadcast Status
- Eazybe Last Broadcast Failure Reason
- Eazybe Last Broadcast At
Open the HubSpot report builder
Open Reports
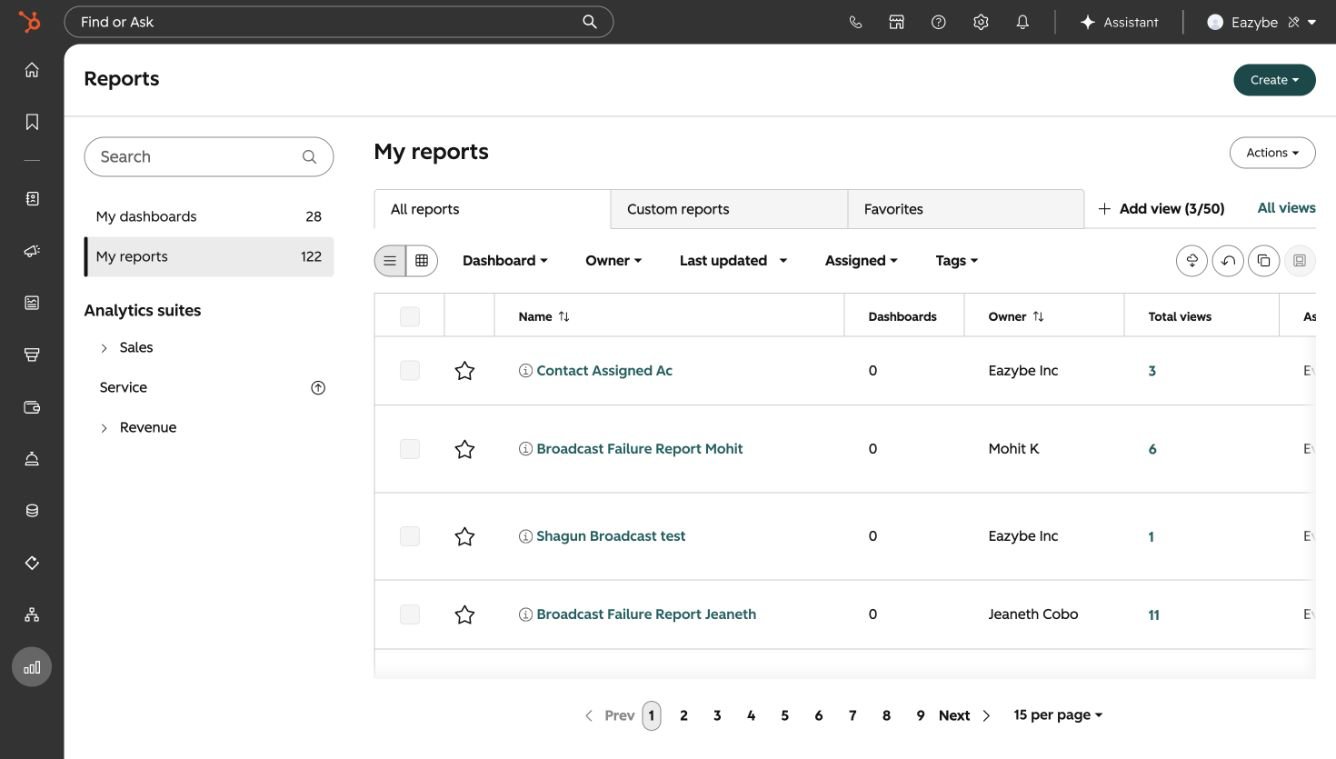
HubSpot Reports page
Create a report
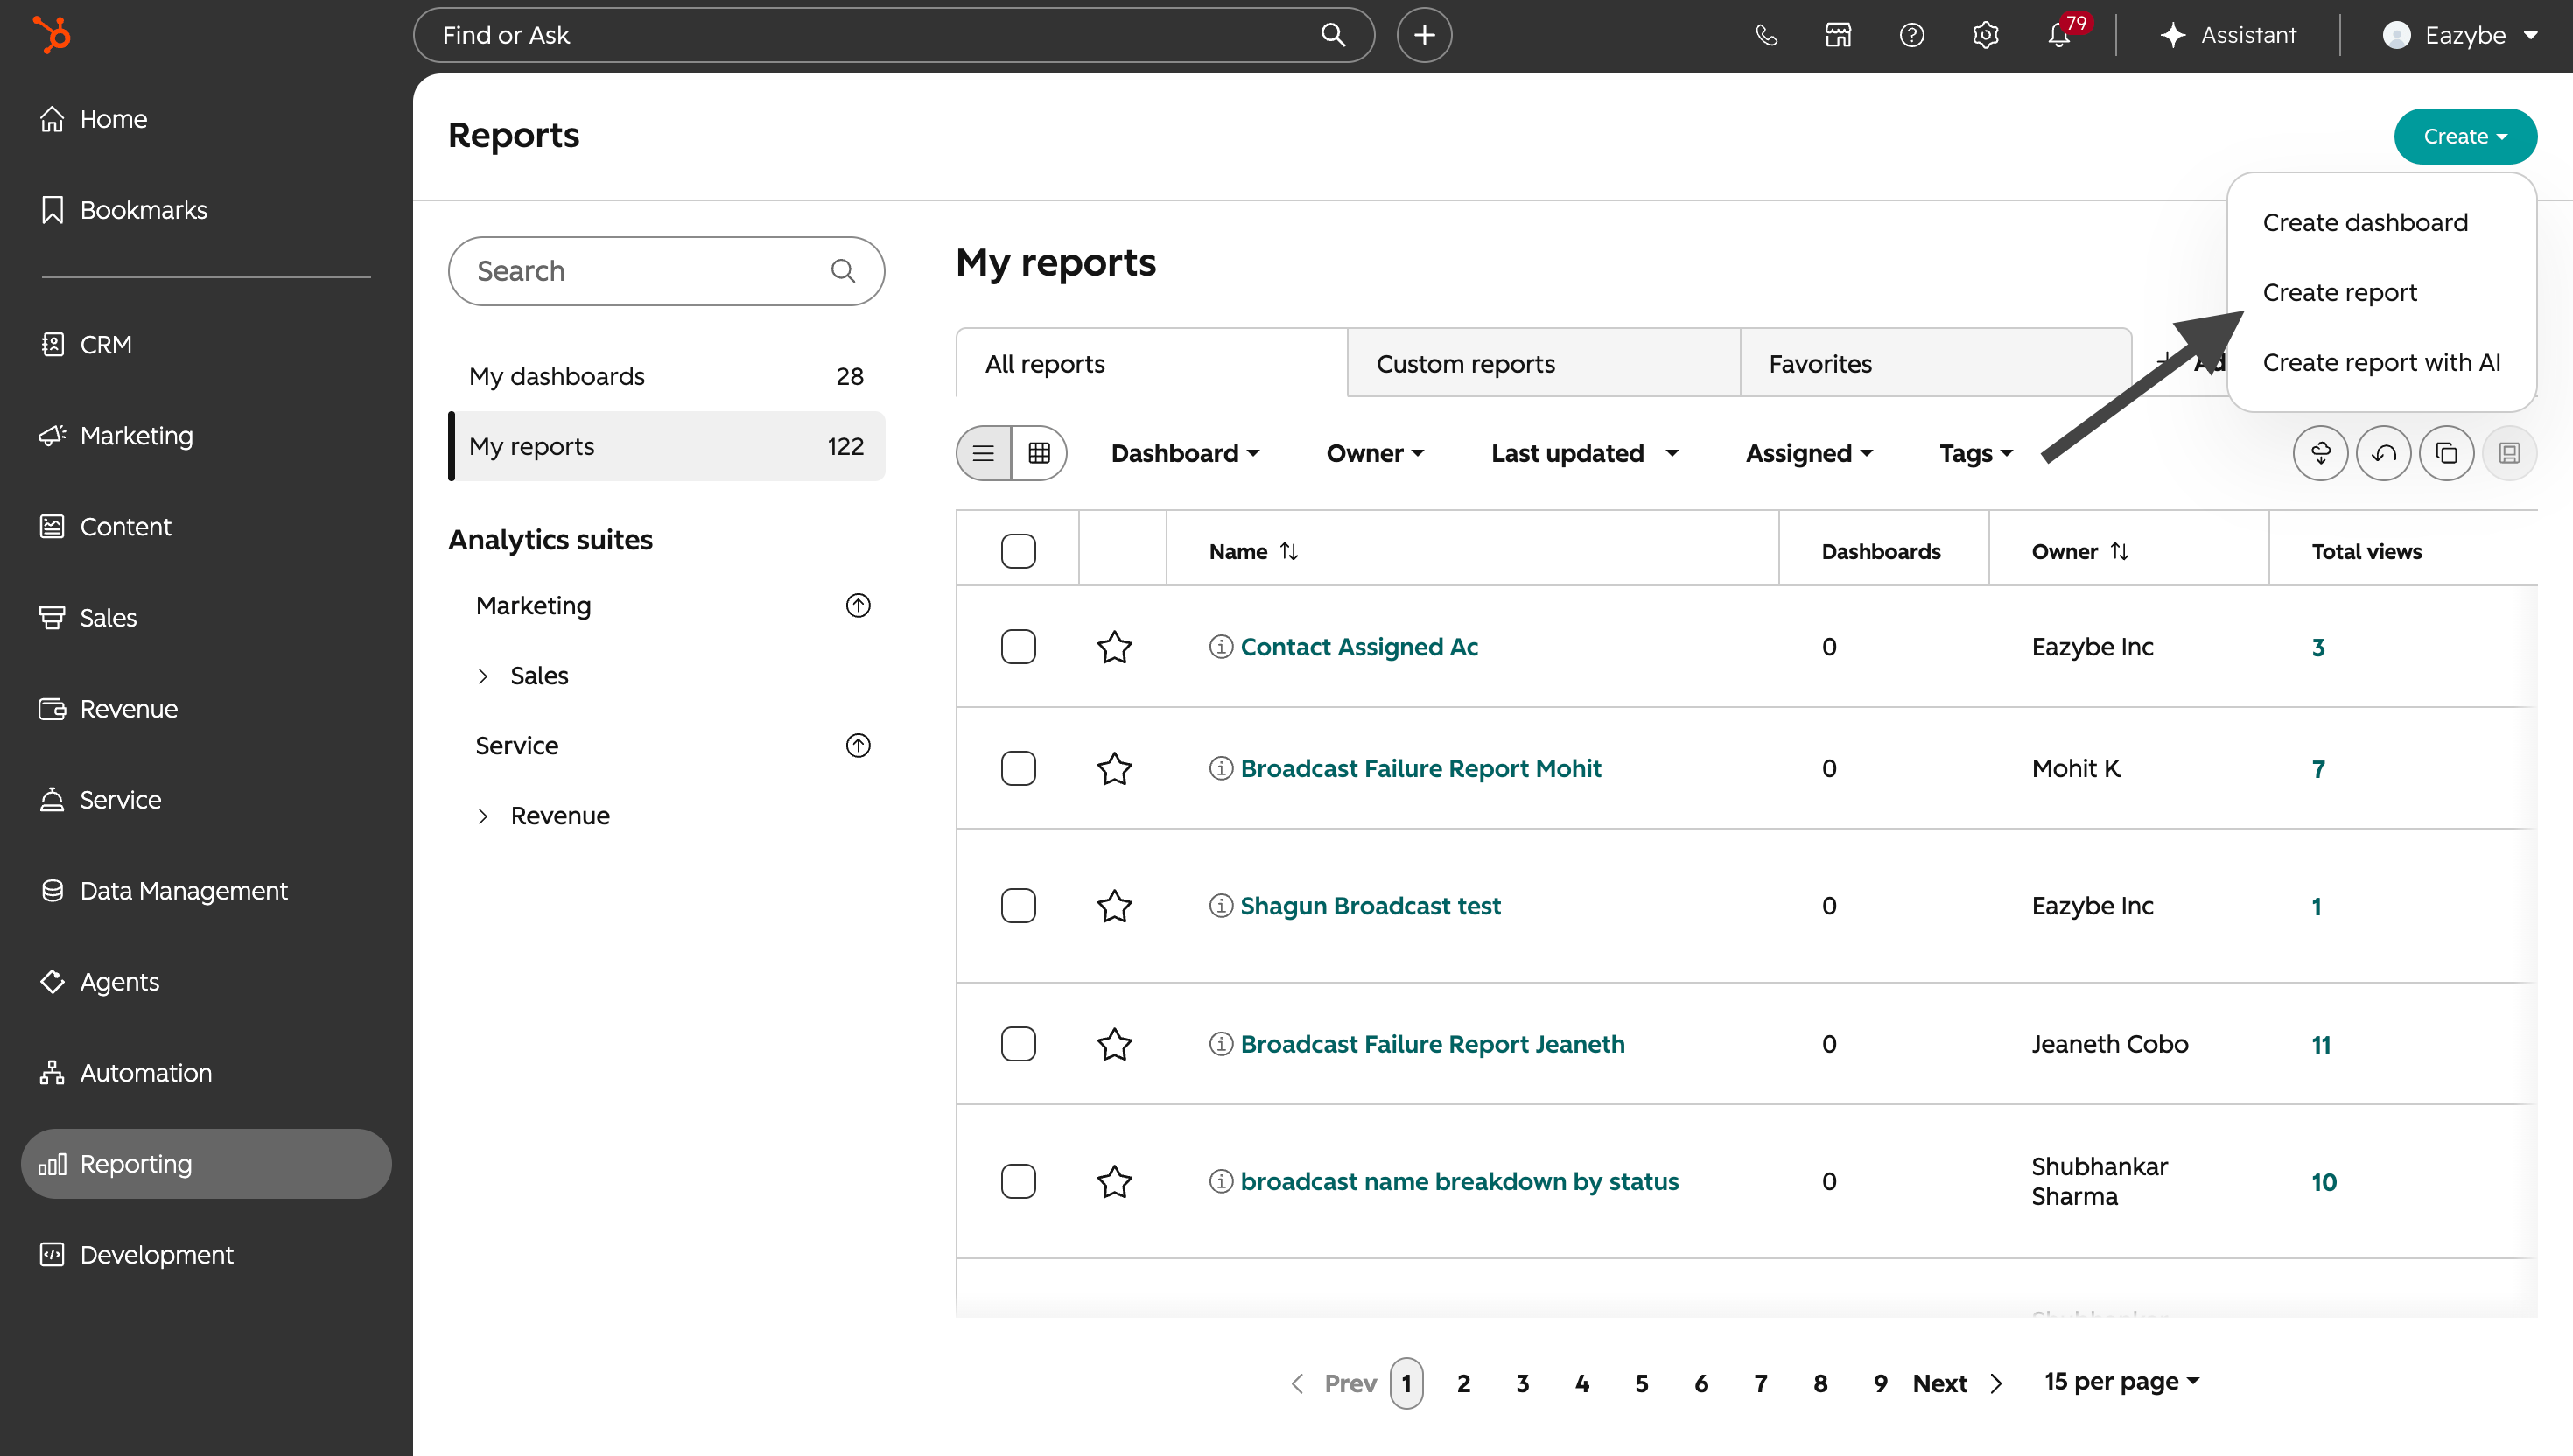
Create a report from the HubSpot Reports page
Choose the custom report builder
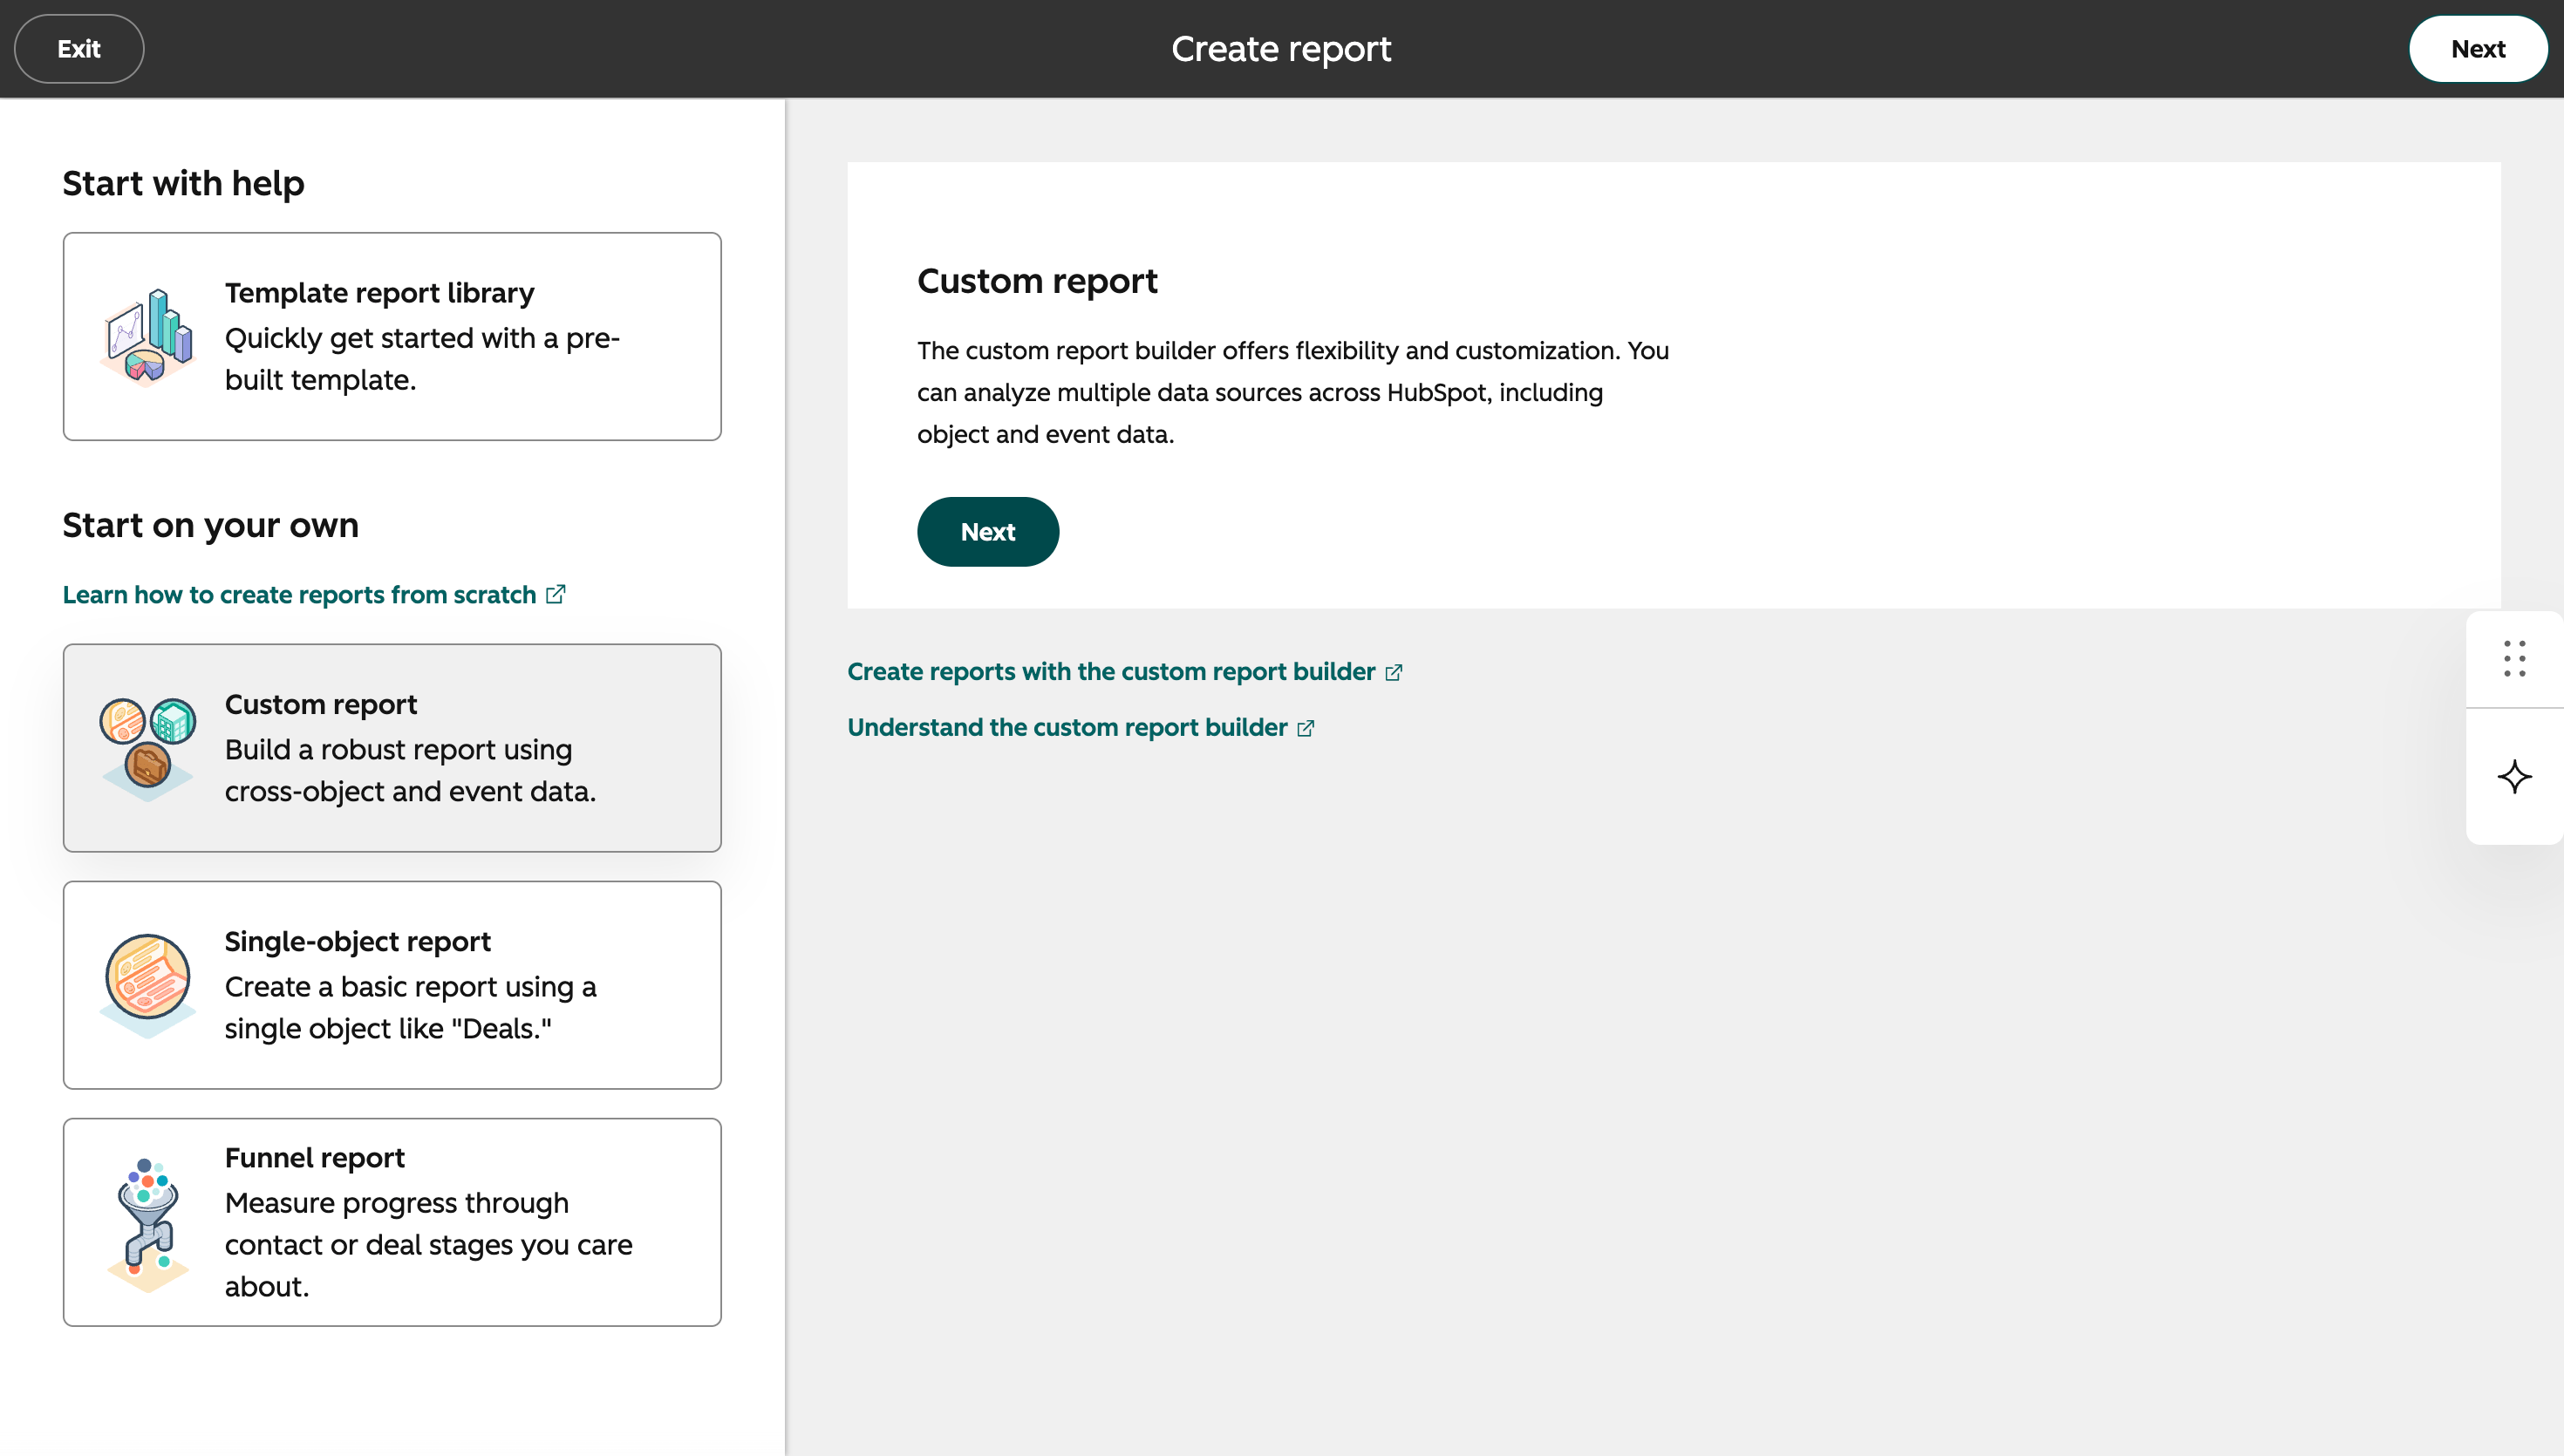
Choose the HubSpot custom report builder
Select the data source
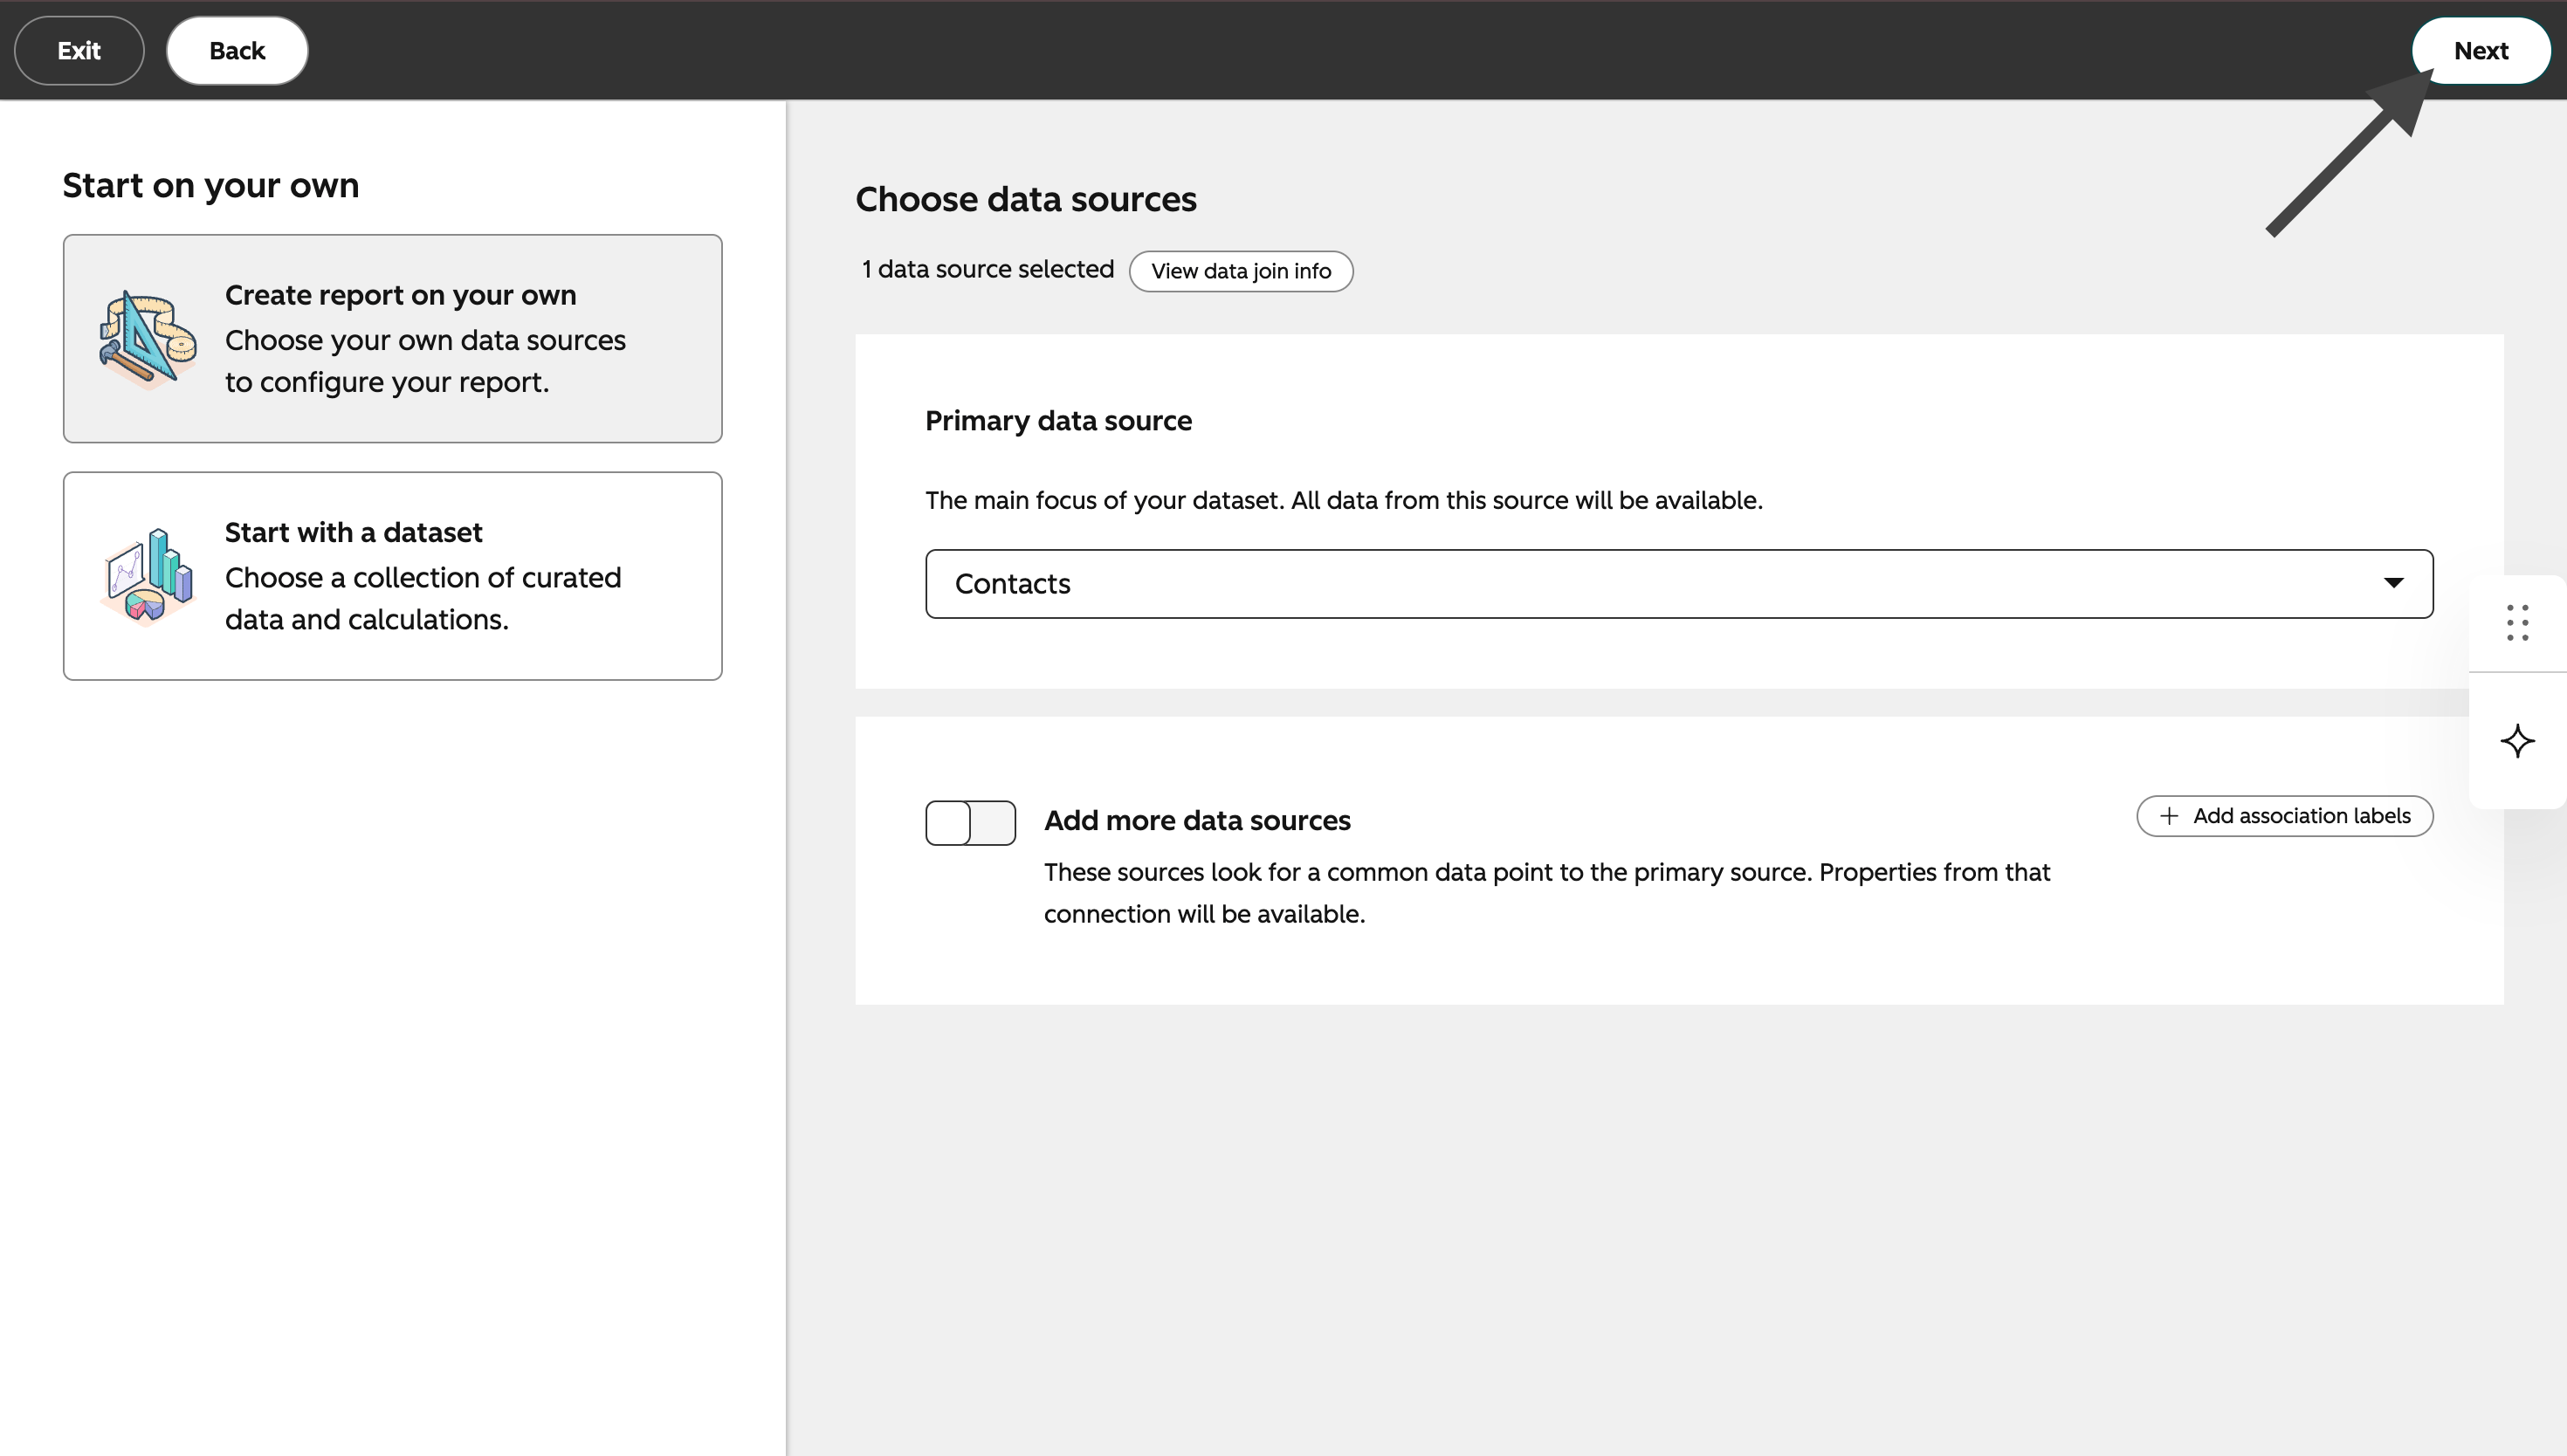
Select Contacts as the primary data source
Find the Eazybe properties
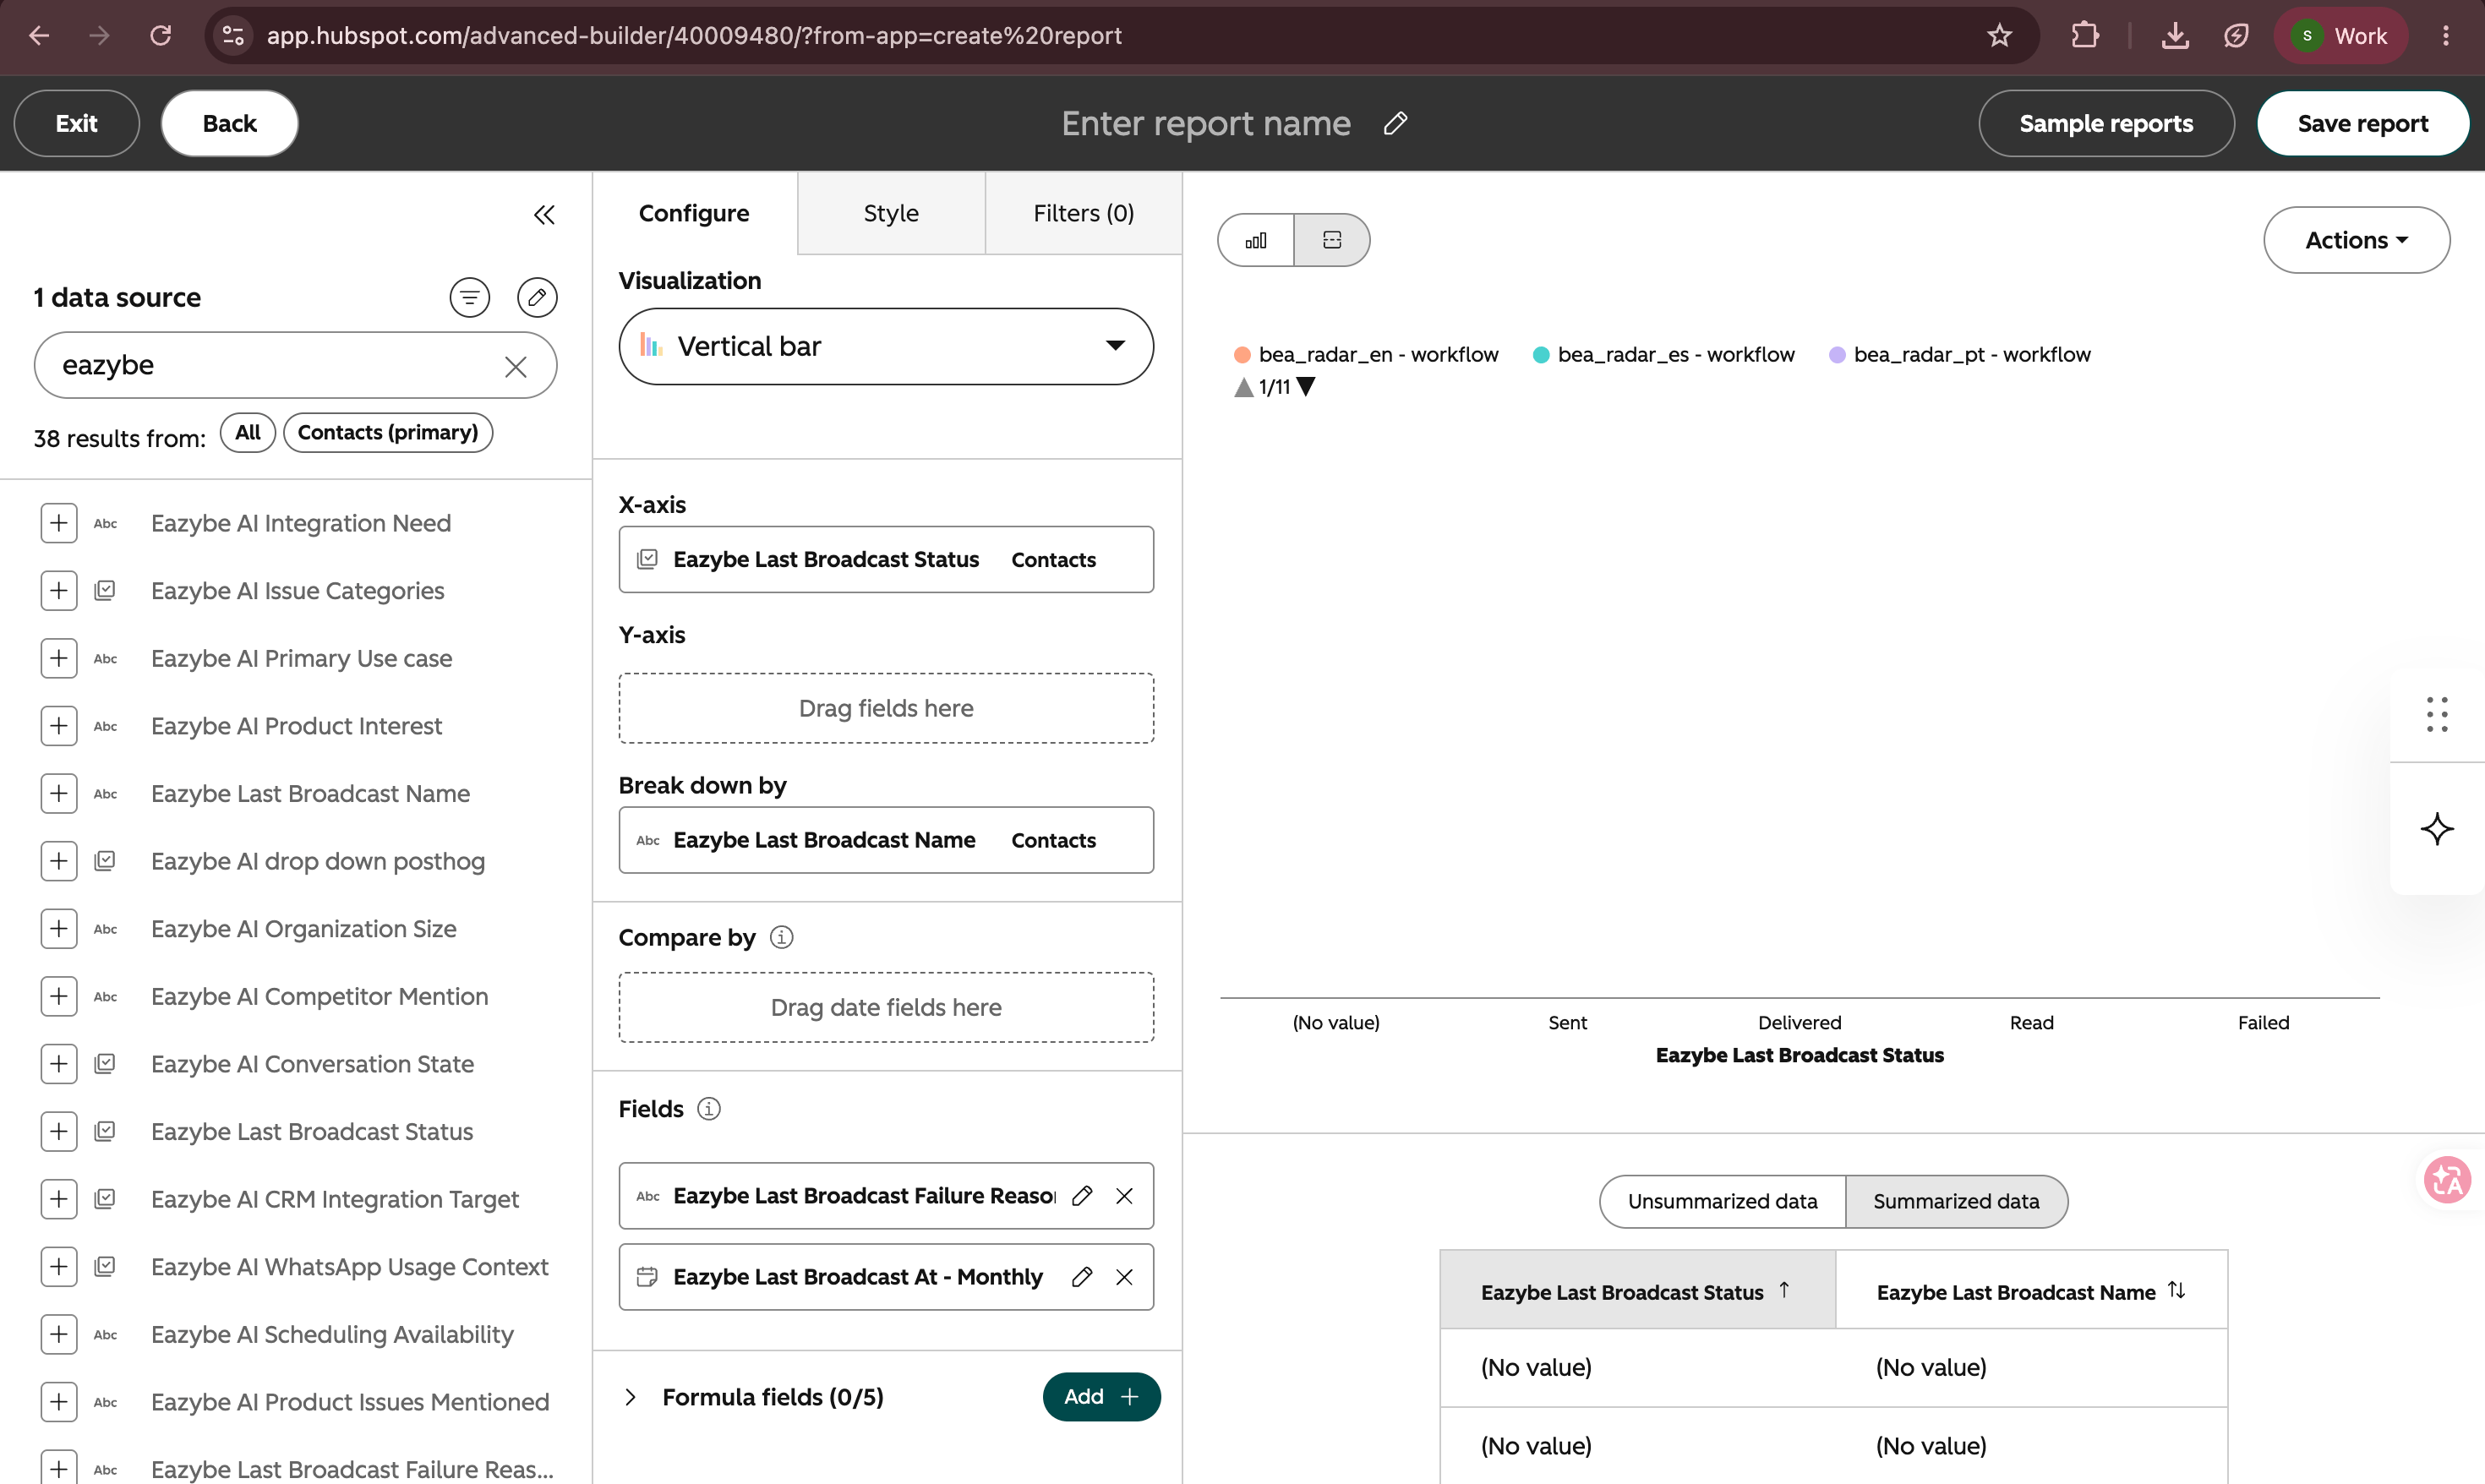
Eazybe properties in the HubSpot report builder
Report 1: Broadcast success by month
This report shows how many contacts had a successful broadcast result each month.Choose the chart
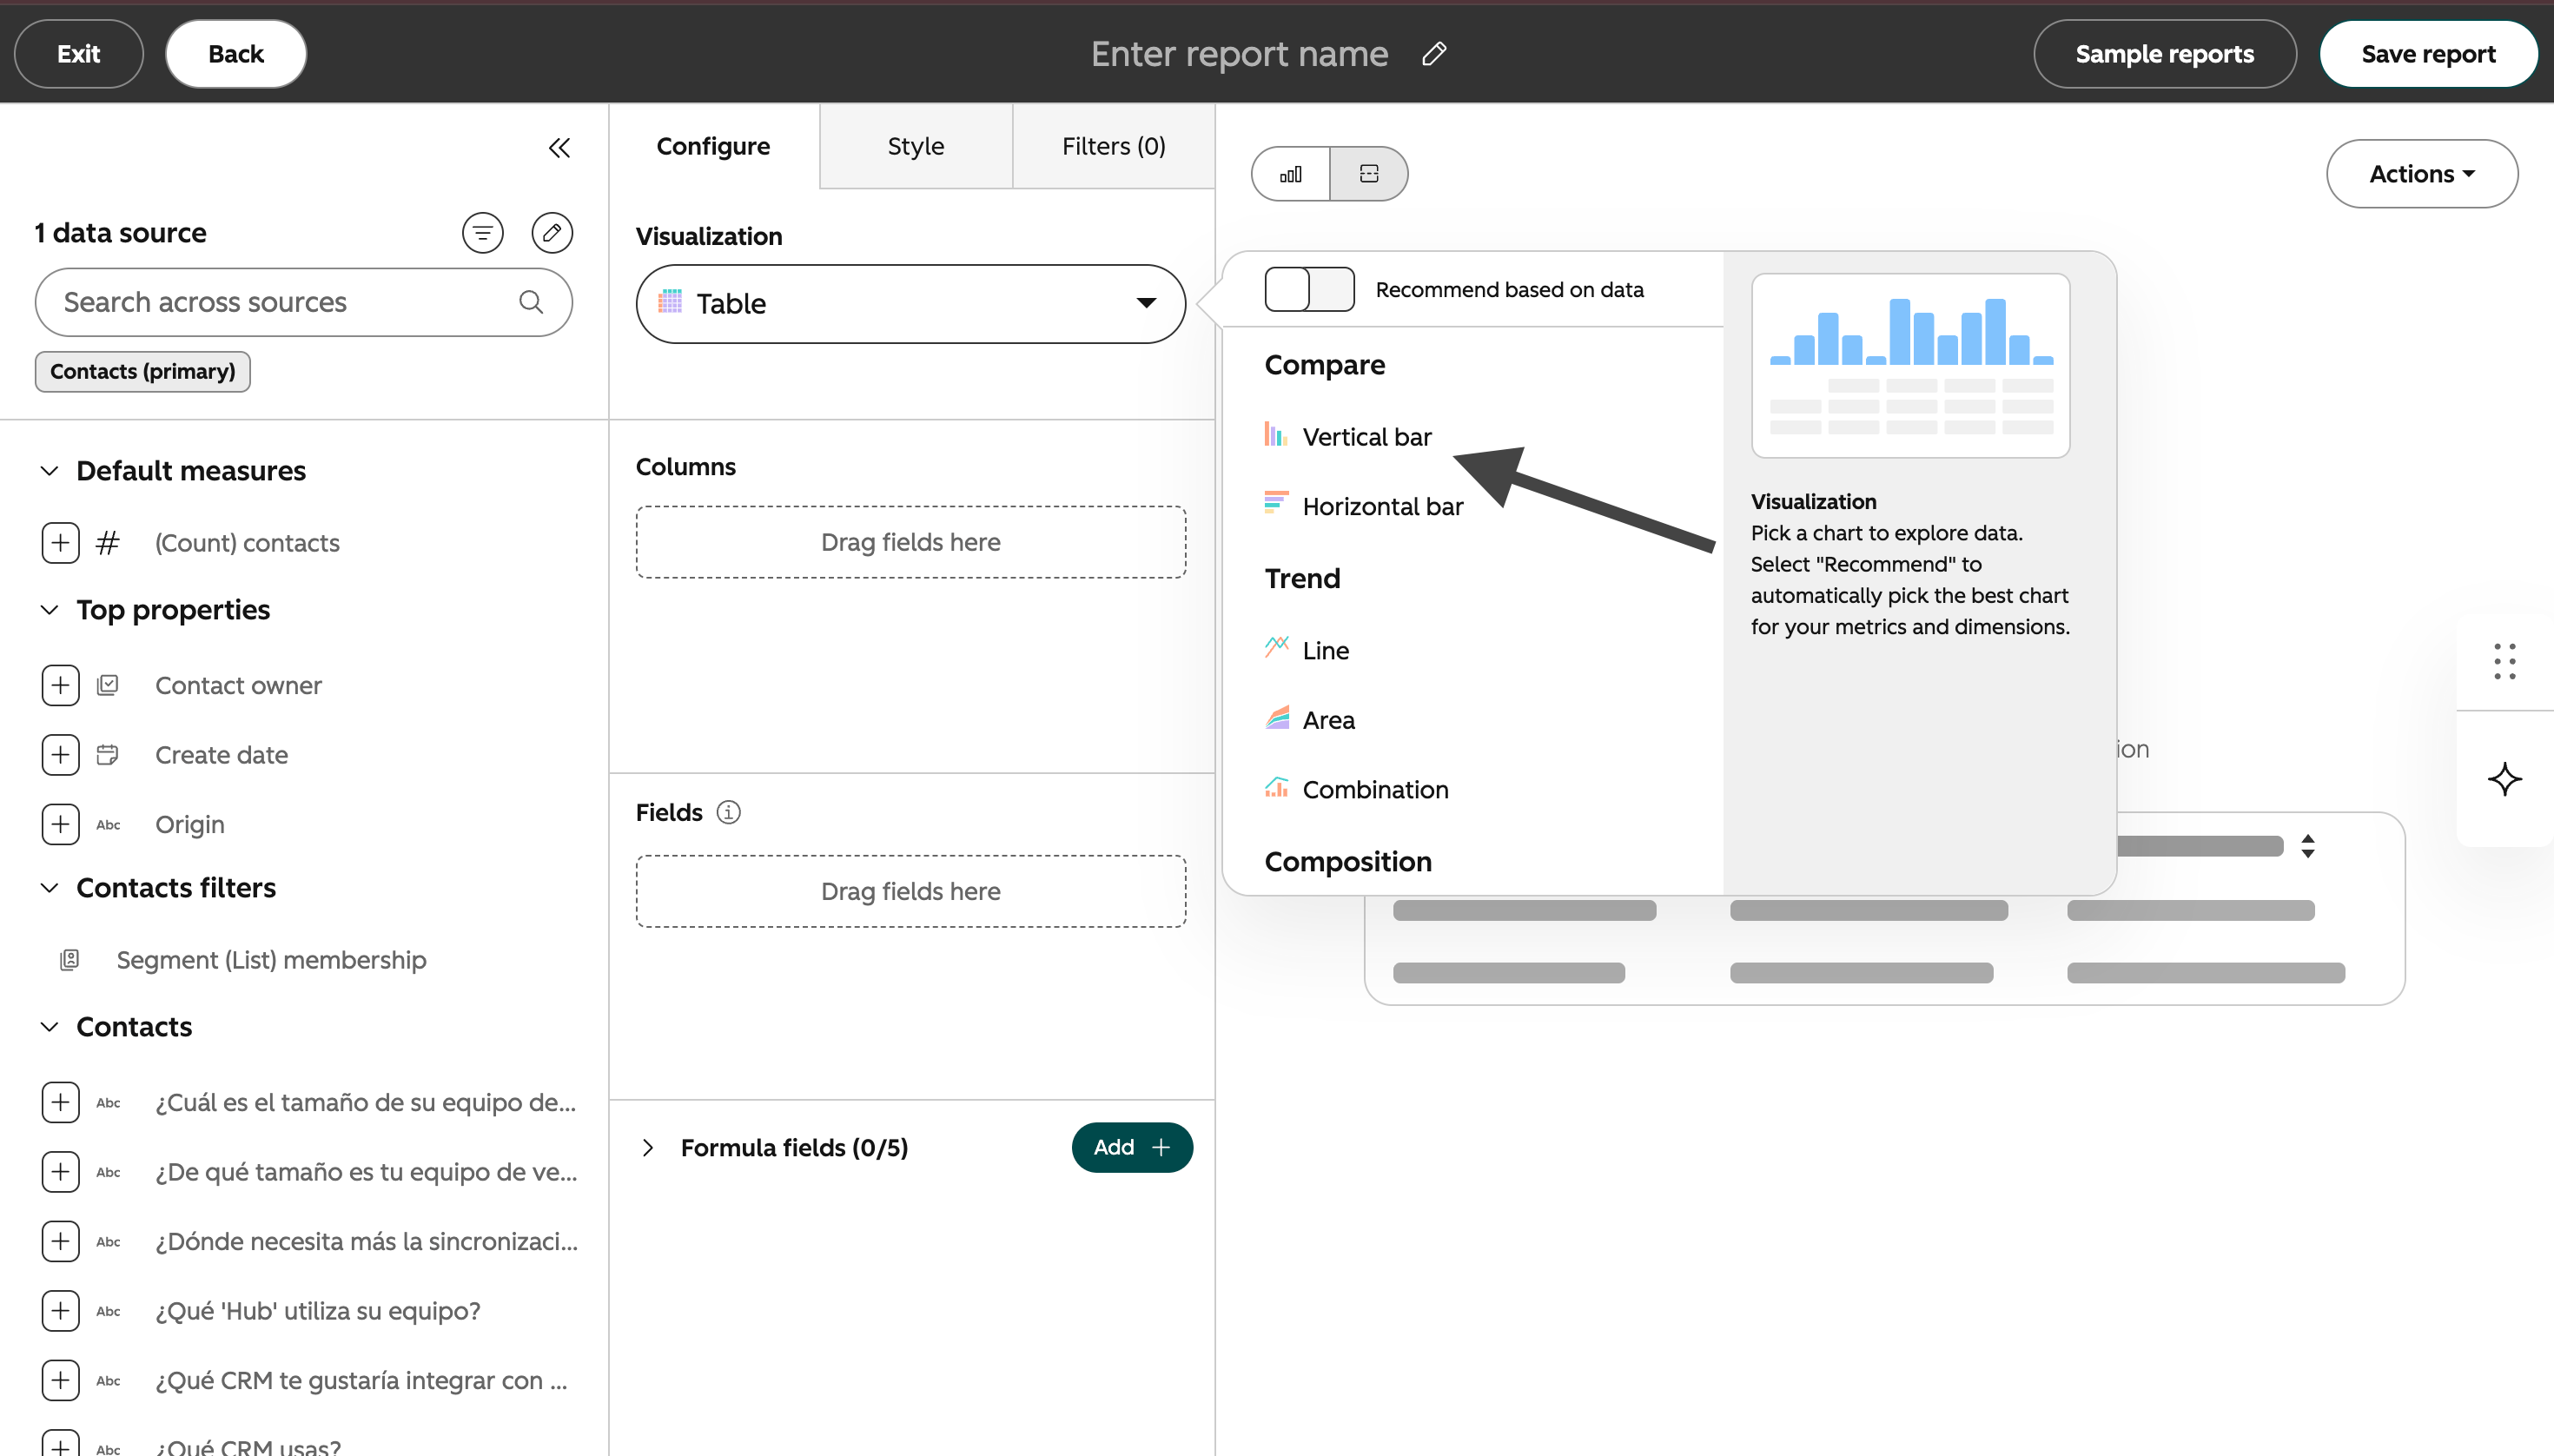
Choose the vertical bar chart visualization
Set the X-axis
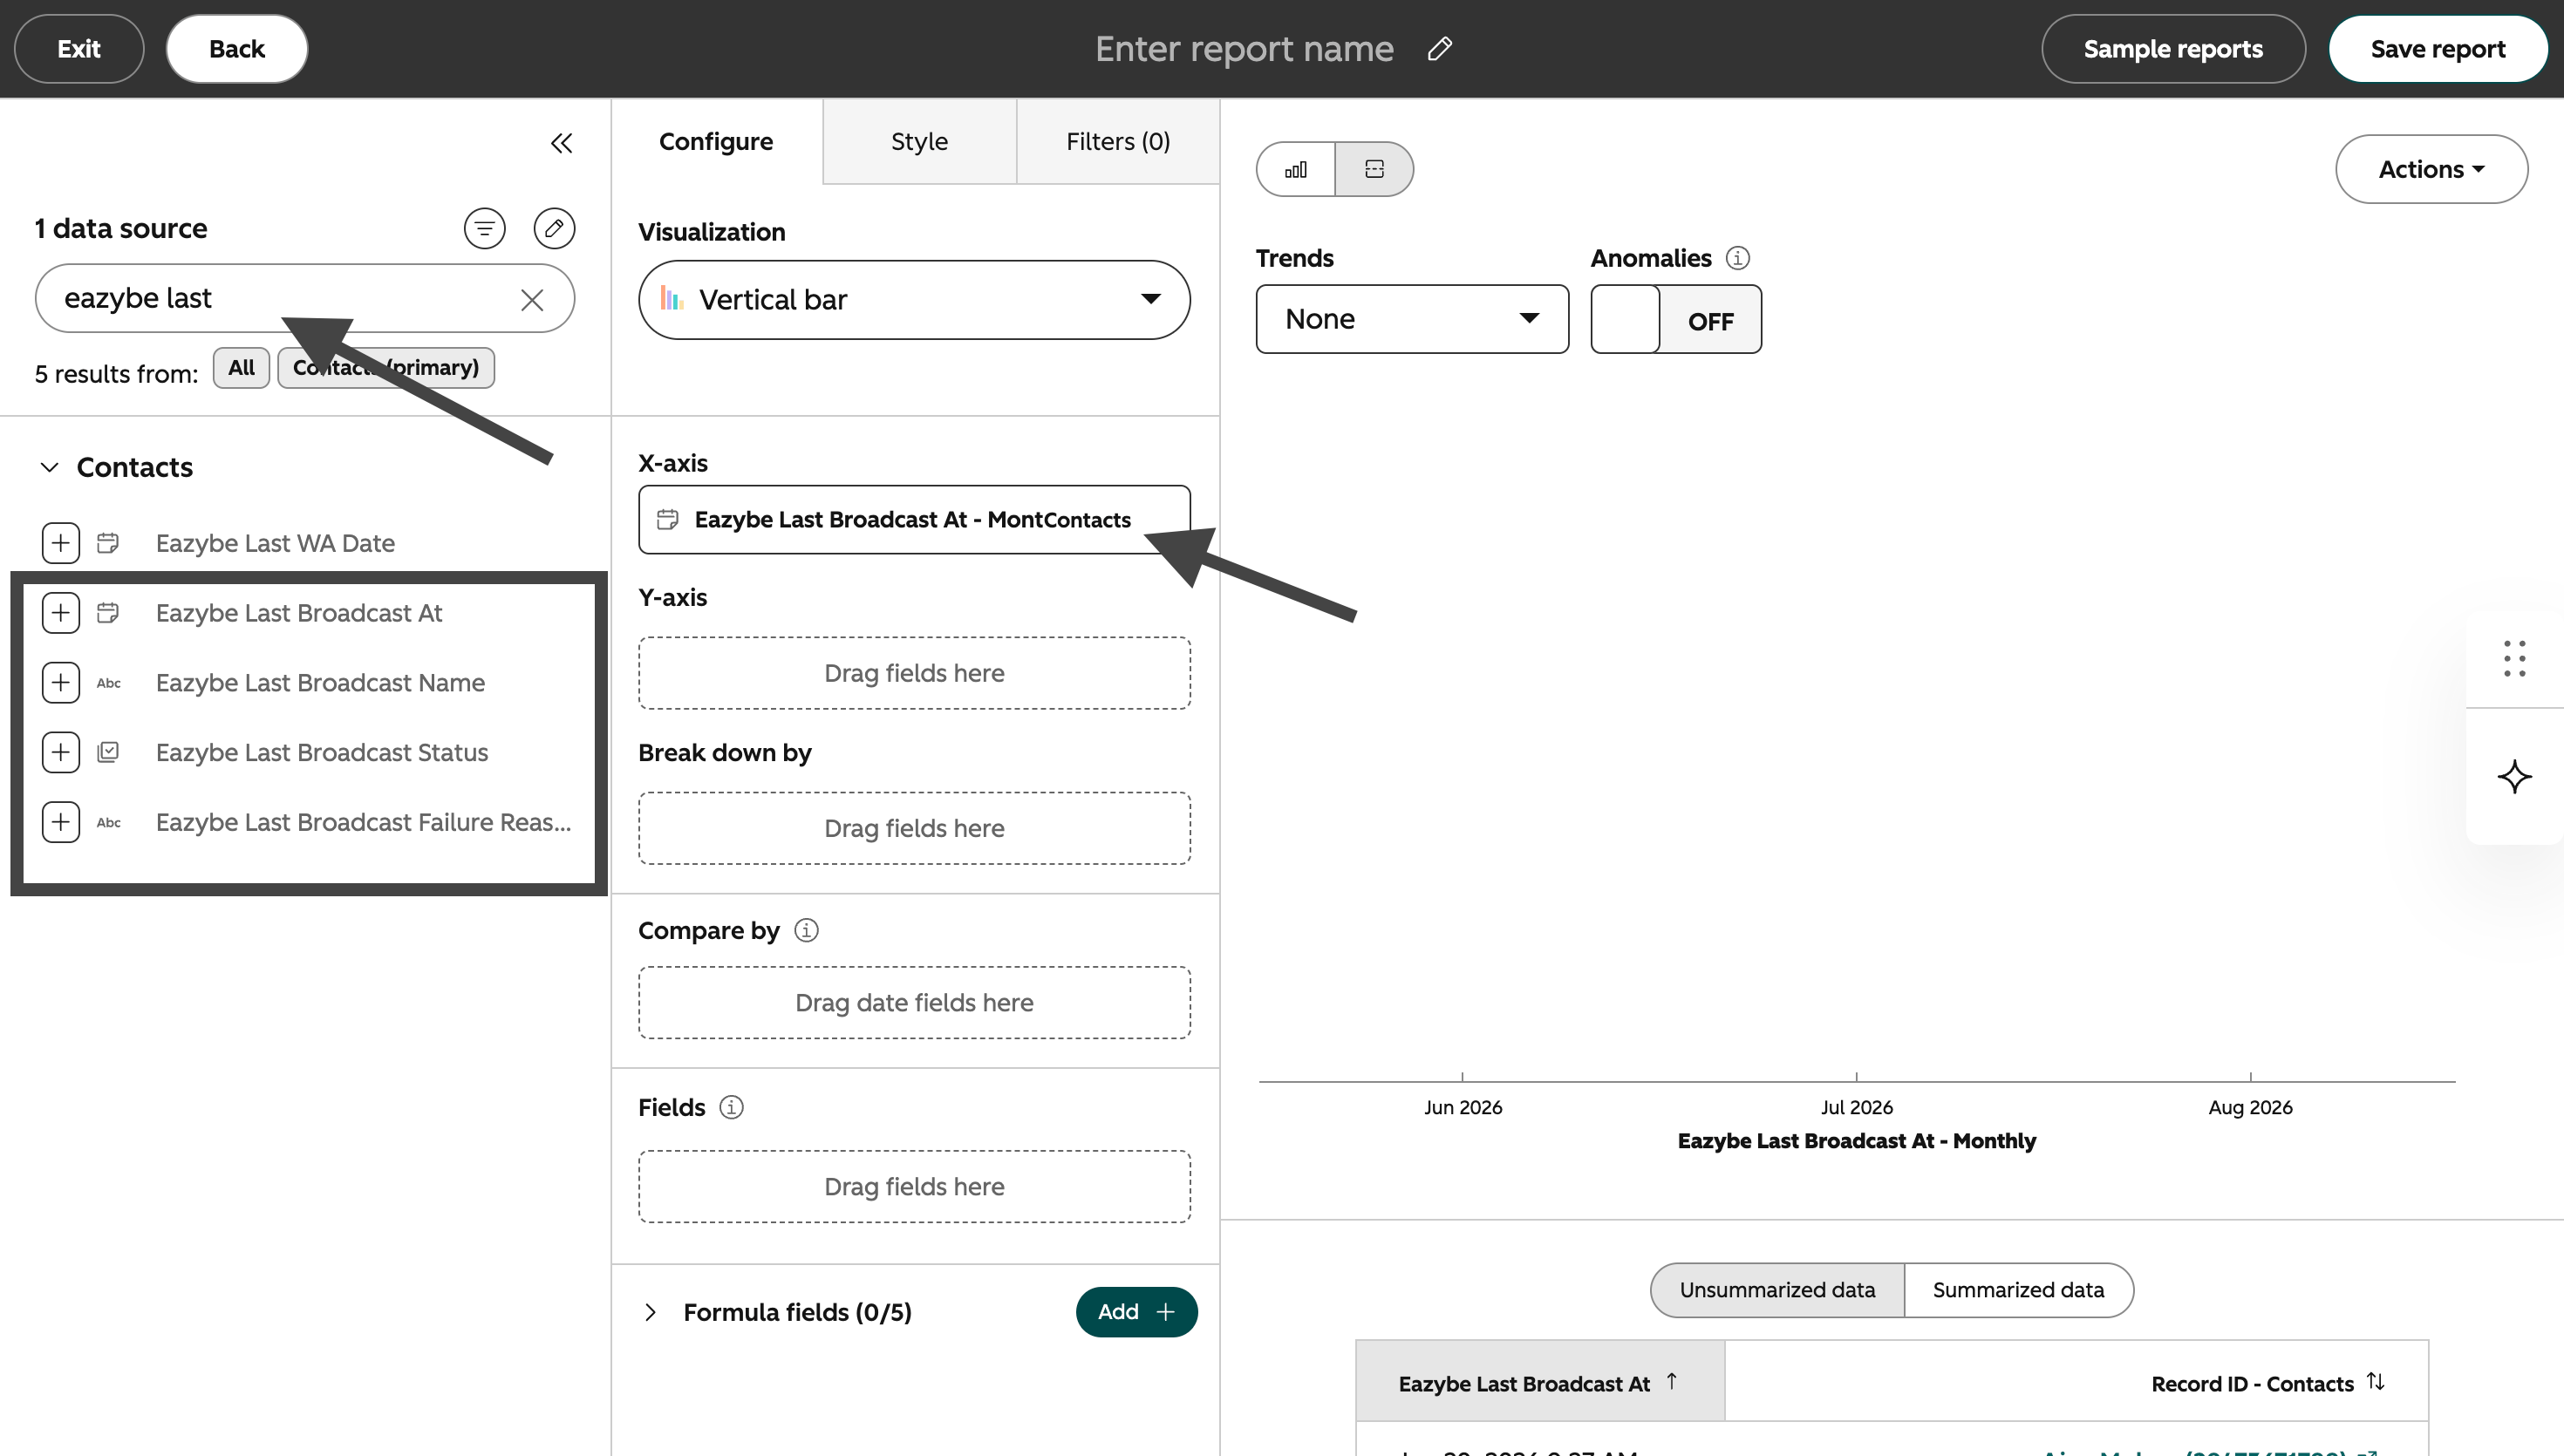
Set Eazybe Last Broadcast At as the monthly X-axis
Set the Y-axis
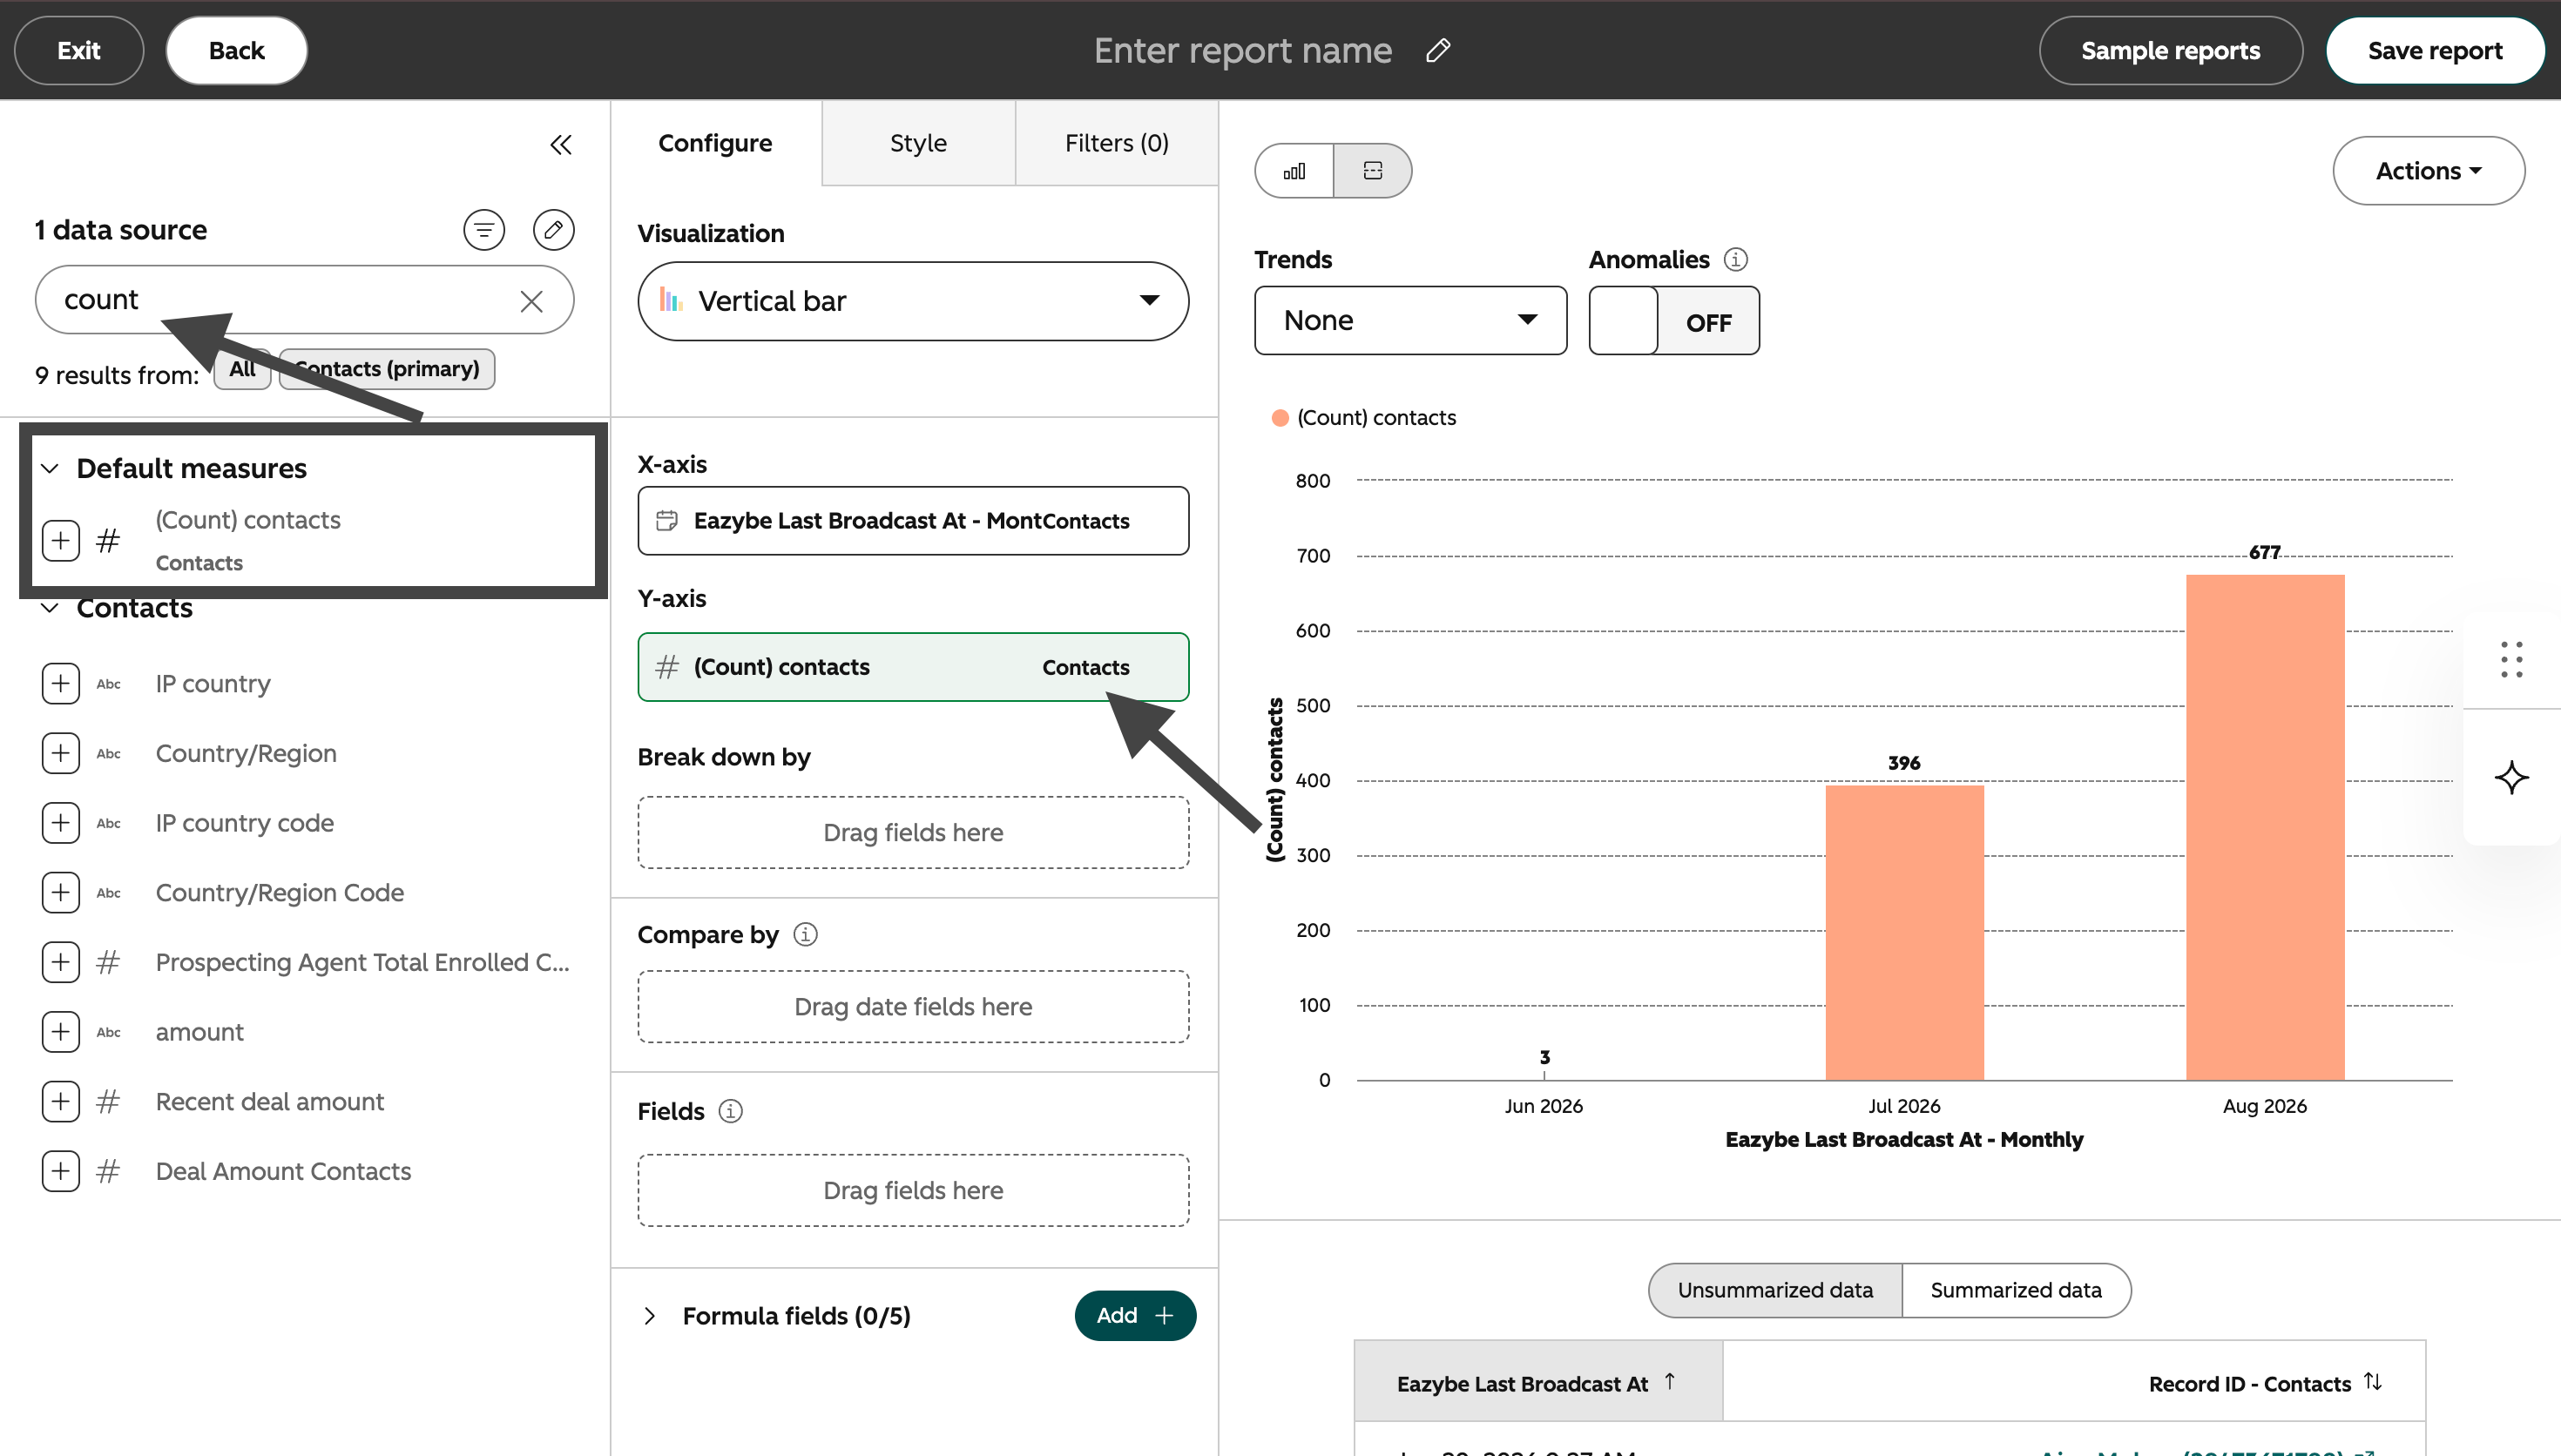
Set Count of contacts as the Y-axis
Add the status breakdown
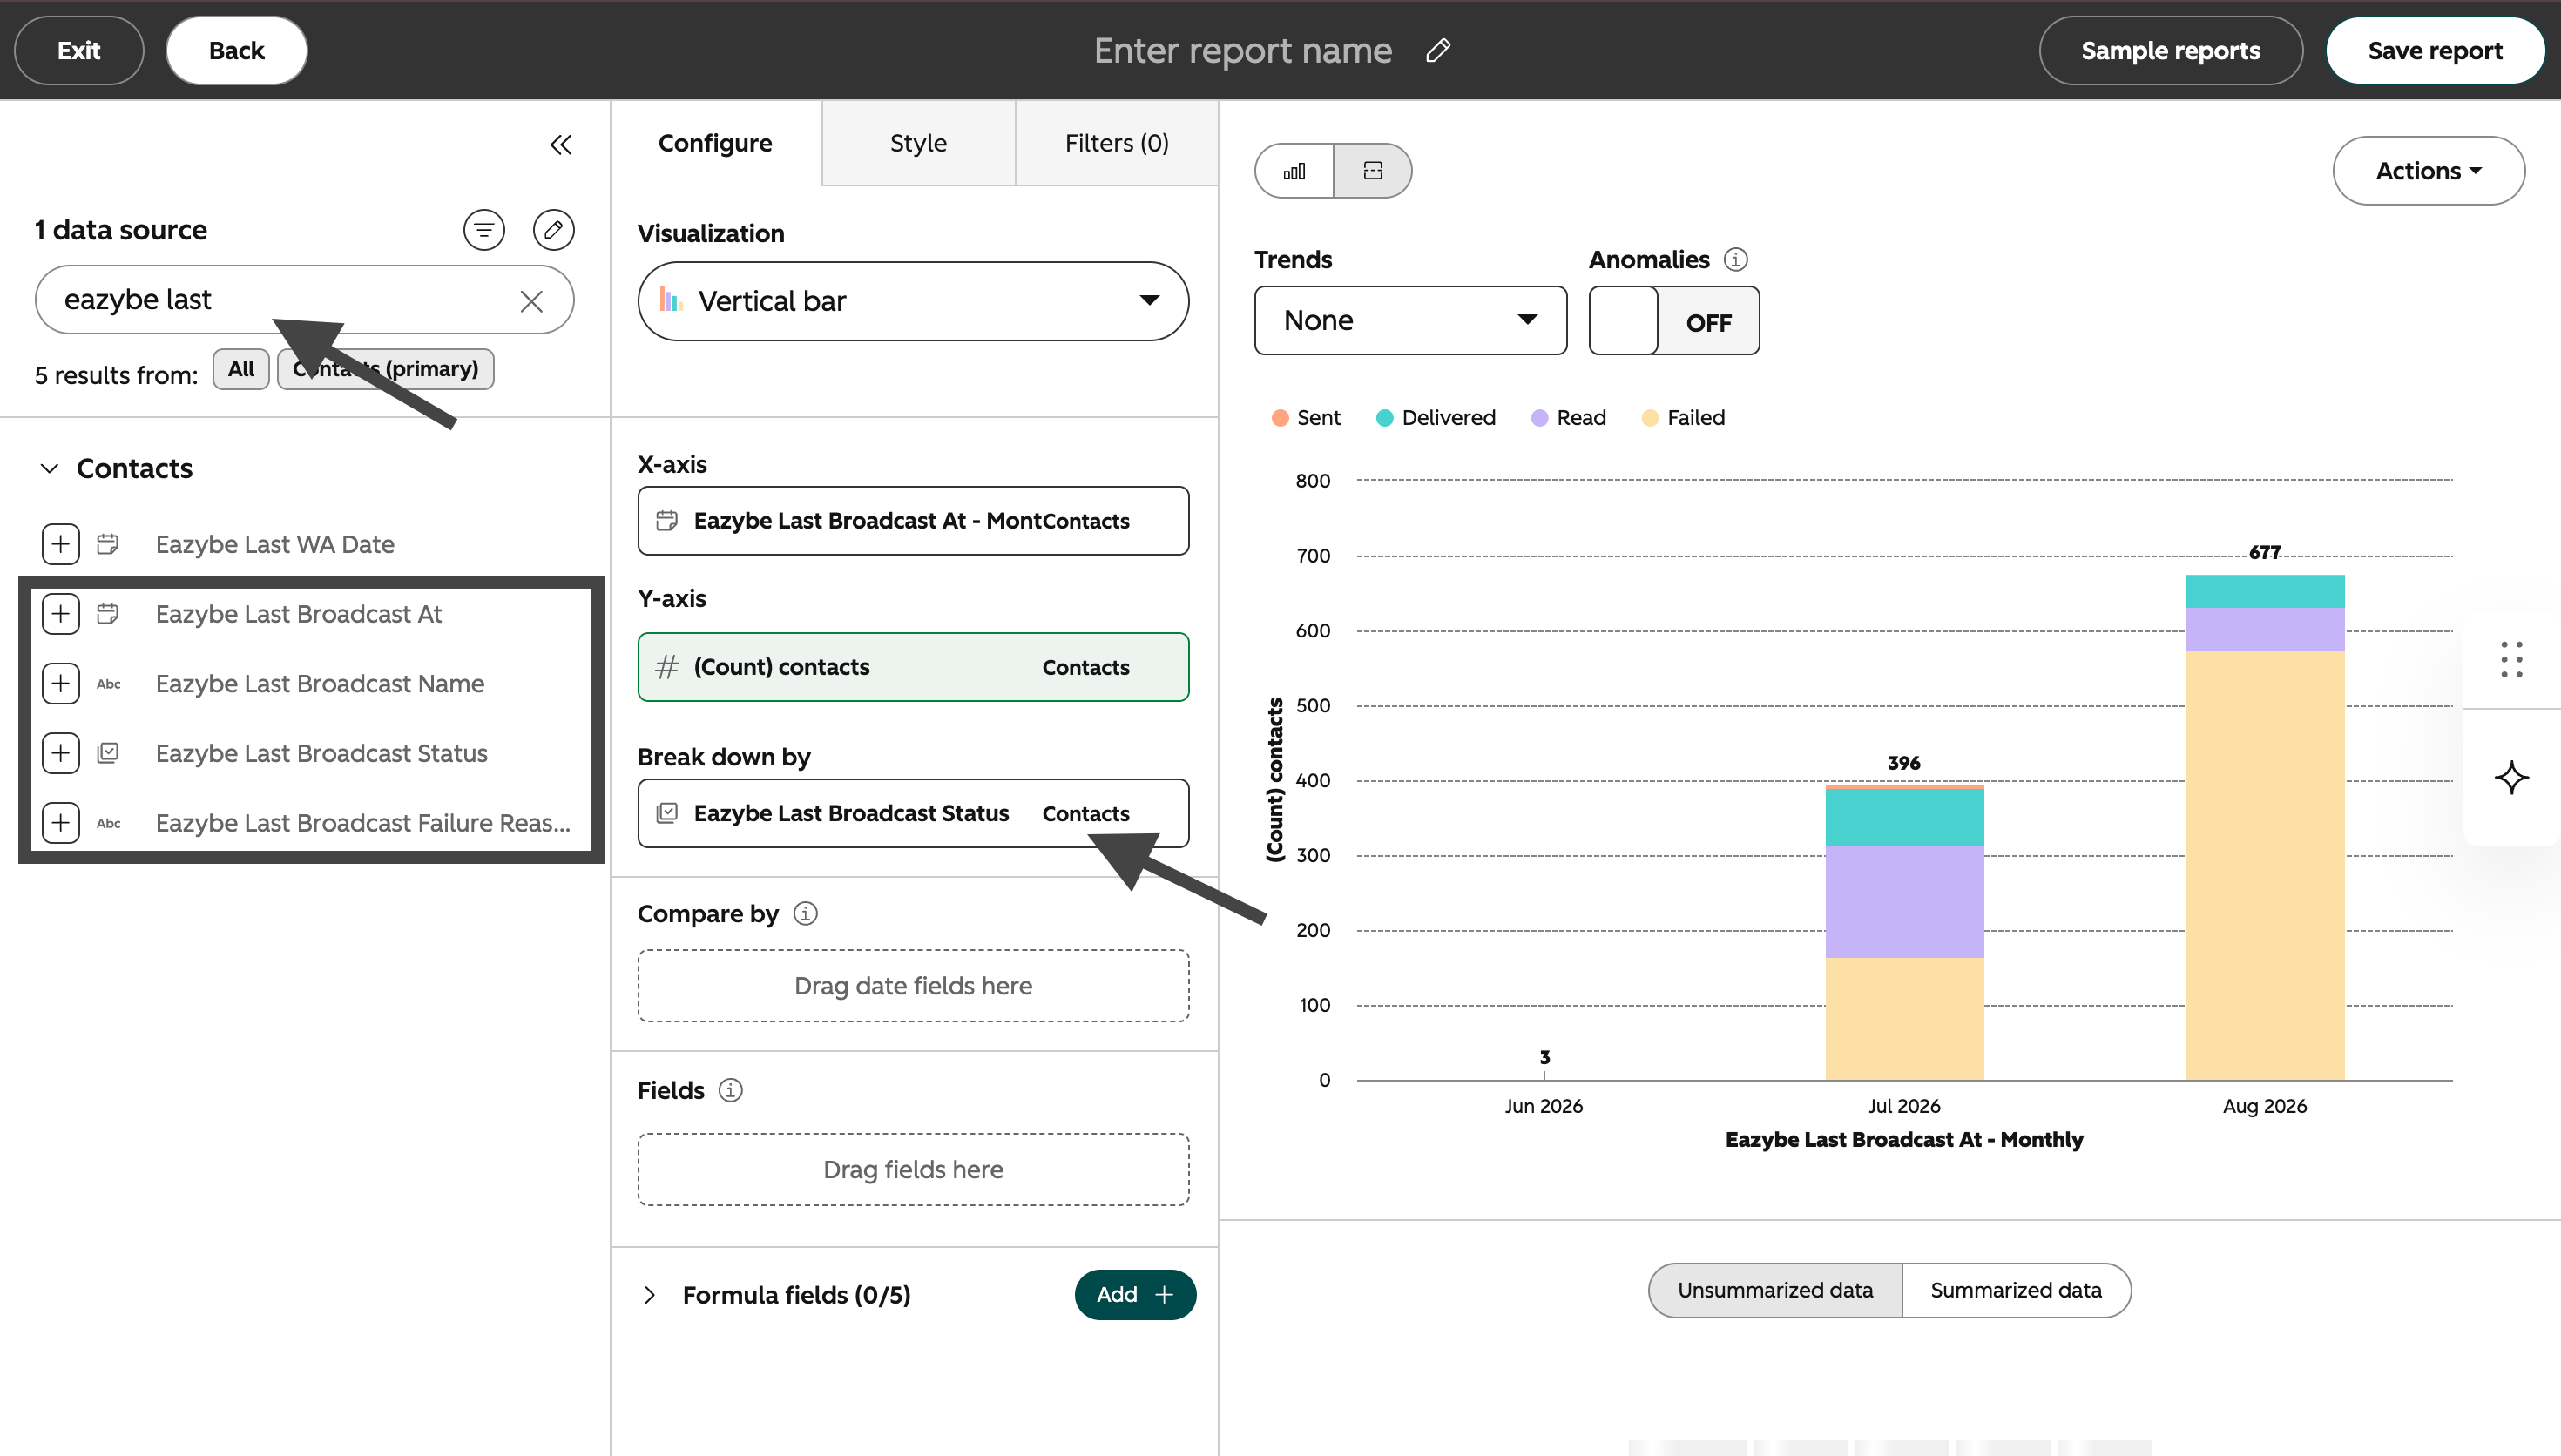
Break down the chart by broadcast status
Apply the success filters
- Eazybe Last Broadcast At is known
- Eazybe Last Broadcast Status is any of Delivered or Read
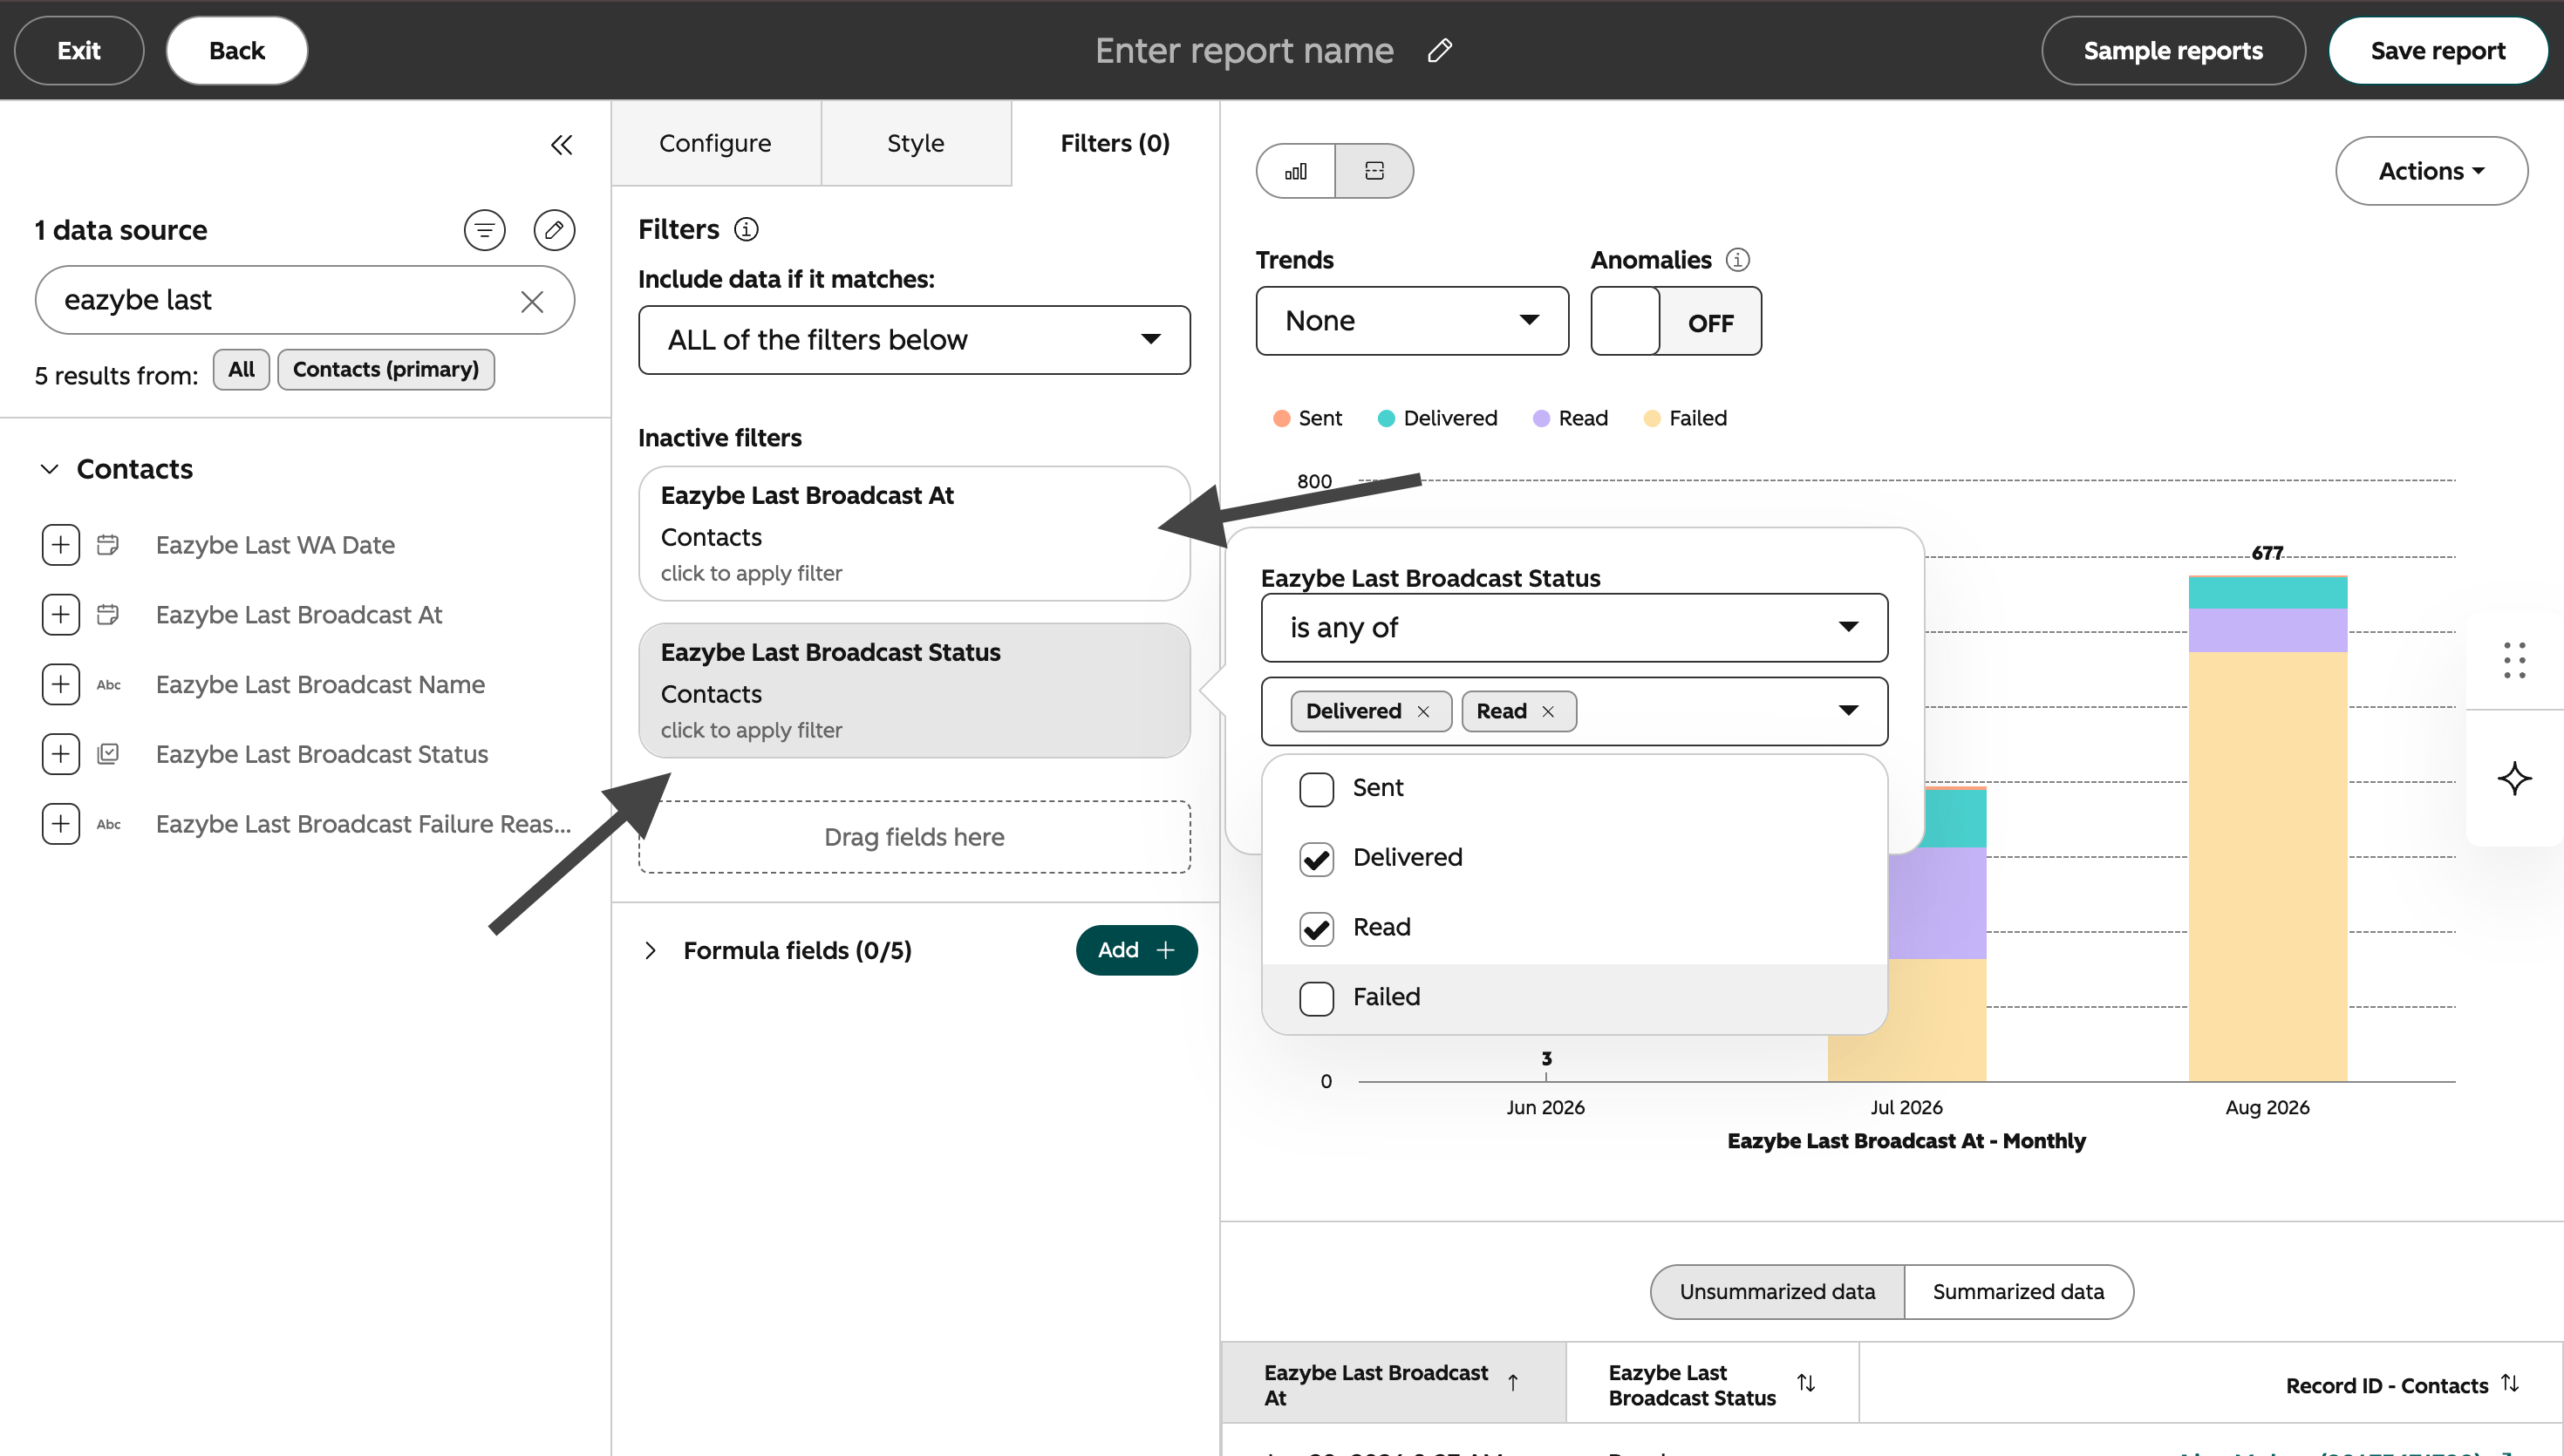
Filter the report for successful broadcasts
Save the report
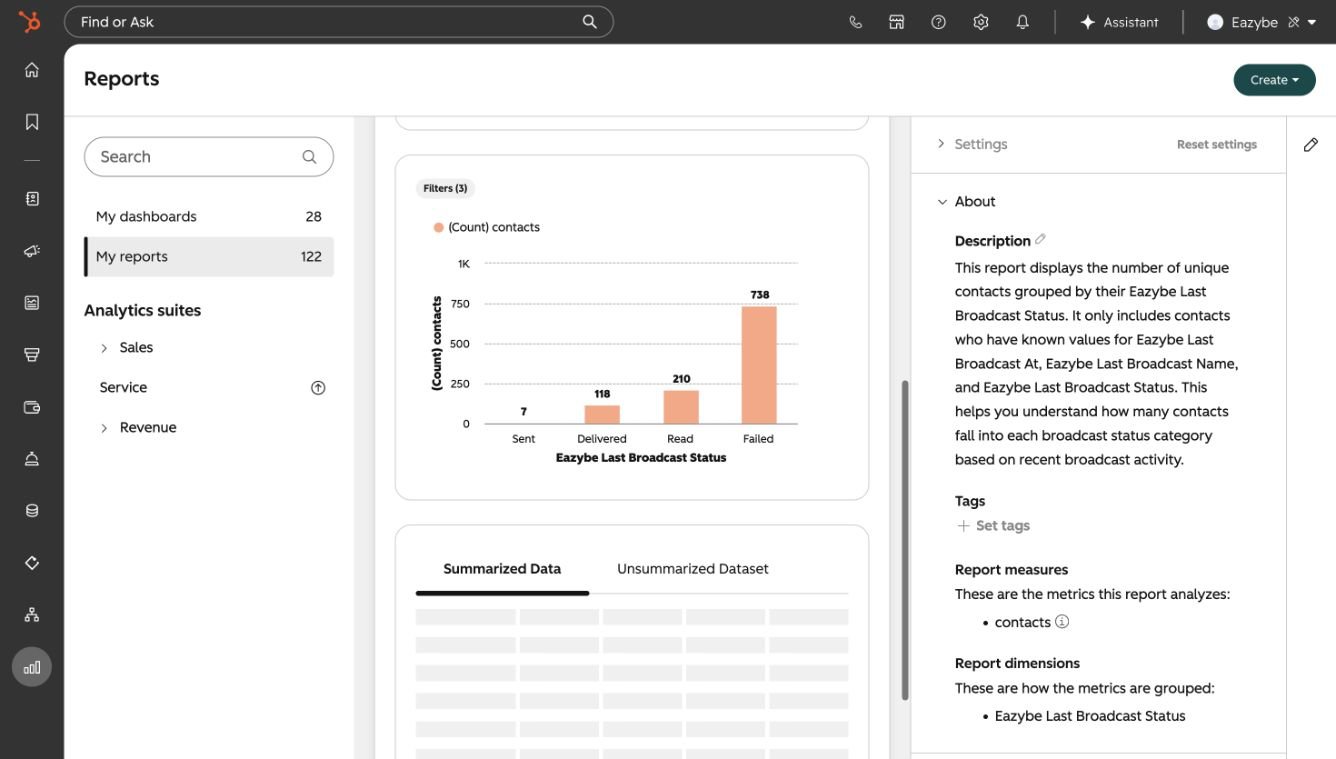
Example of a saved broadcast status report
Report 2: Broadcast failure reasons by month
This report shows why broadcasts failed and how frequently each reason occurred.Create another custom report
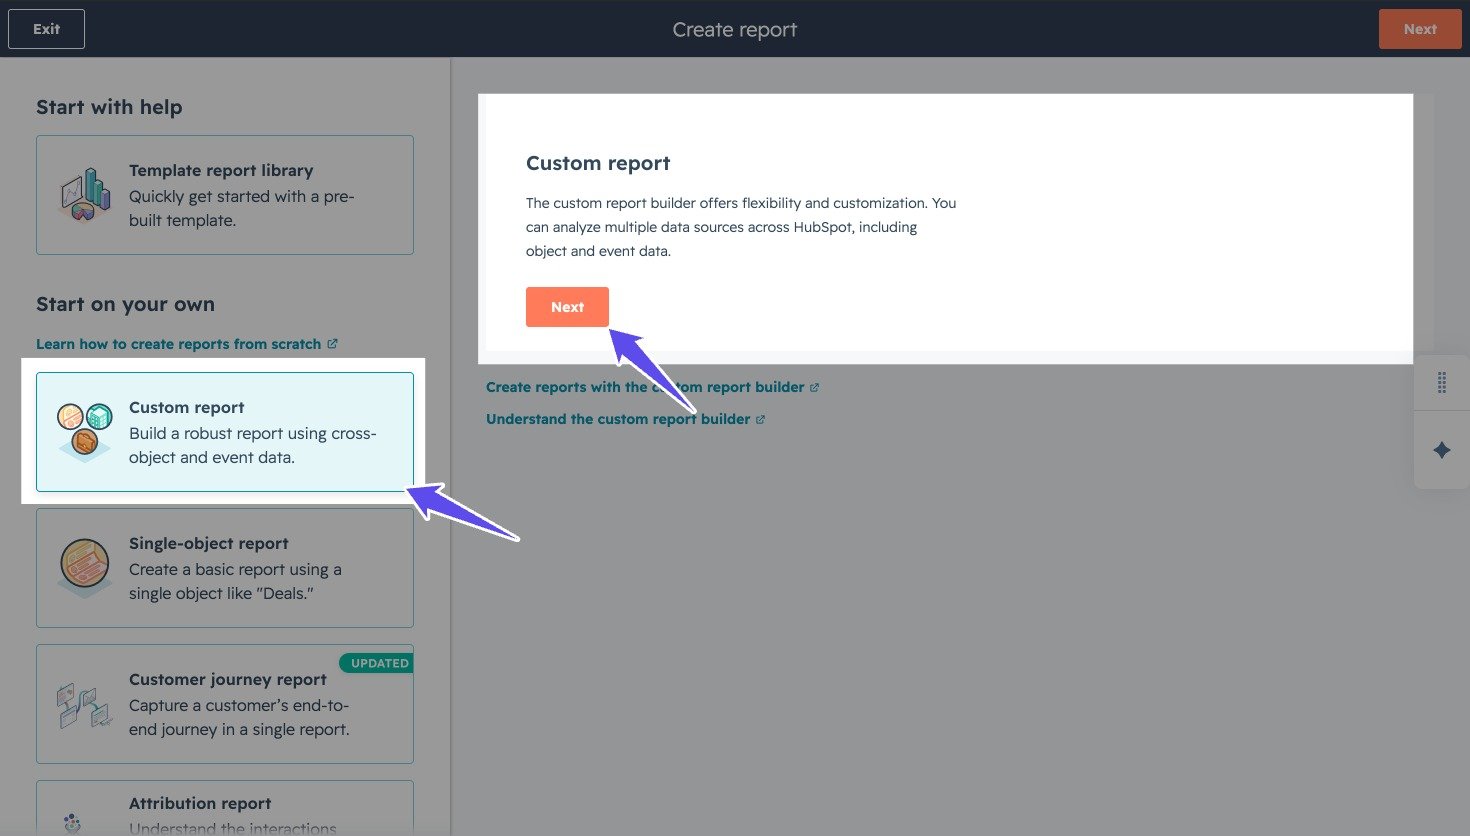
Create another custom report in HubSpot
Choose the chart
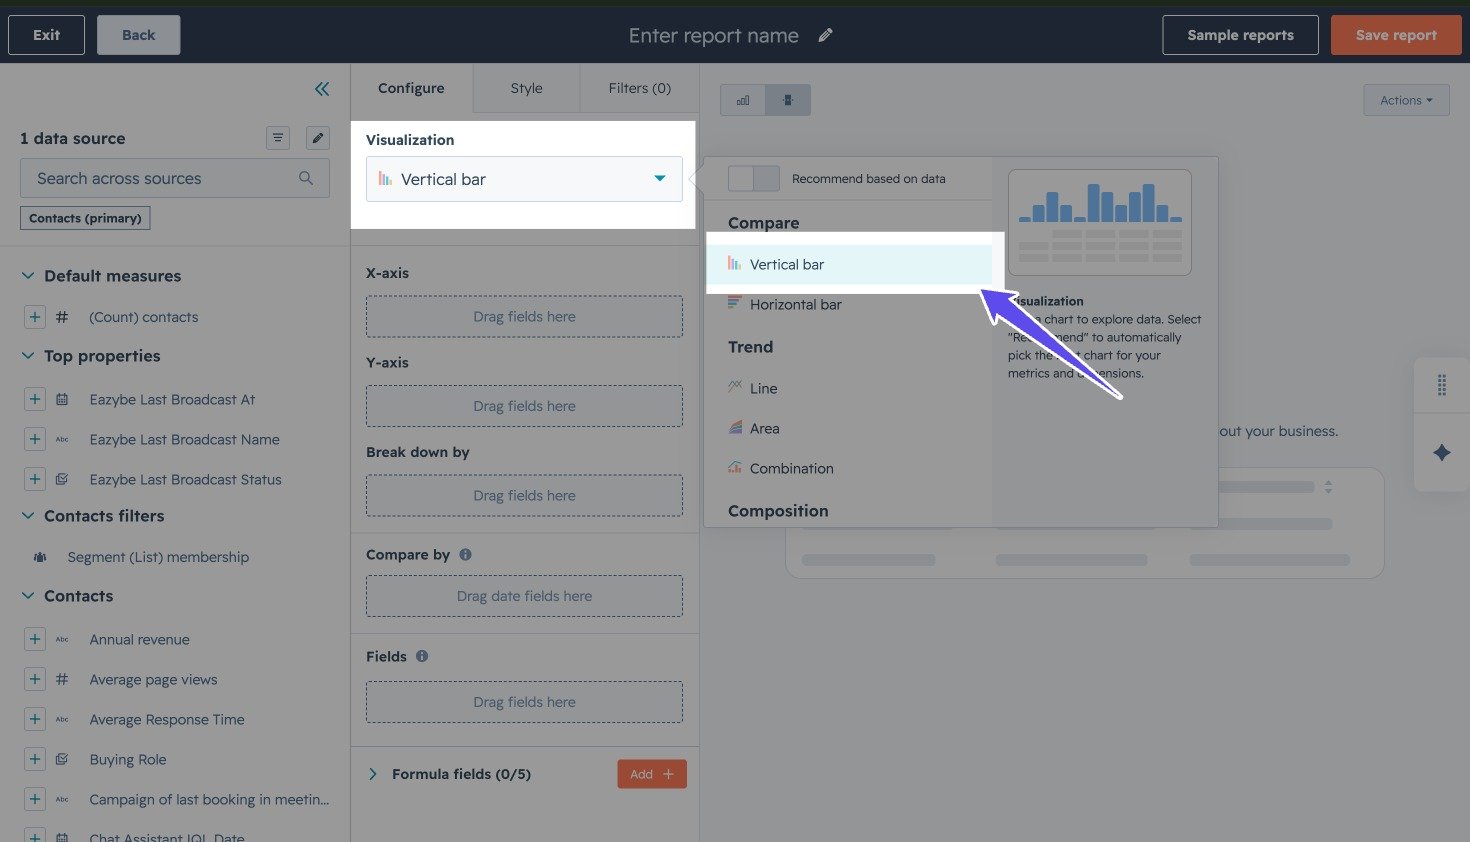
Choose the vertical bar chart for the failure-reasons report
Set the X-axis
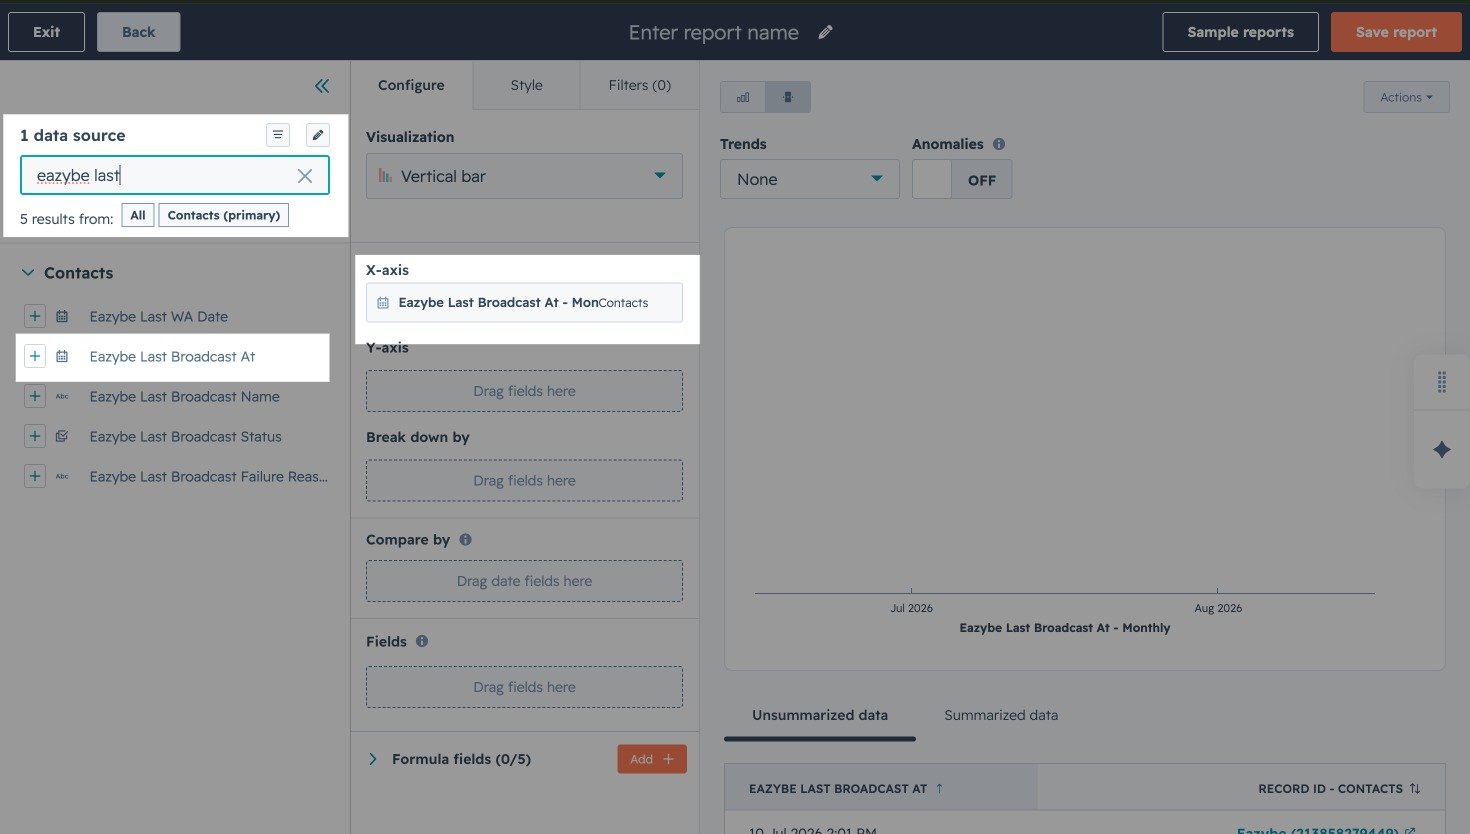
Set the monthly X-axis for the failure-reasons report
Set the Y-axis
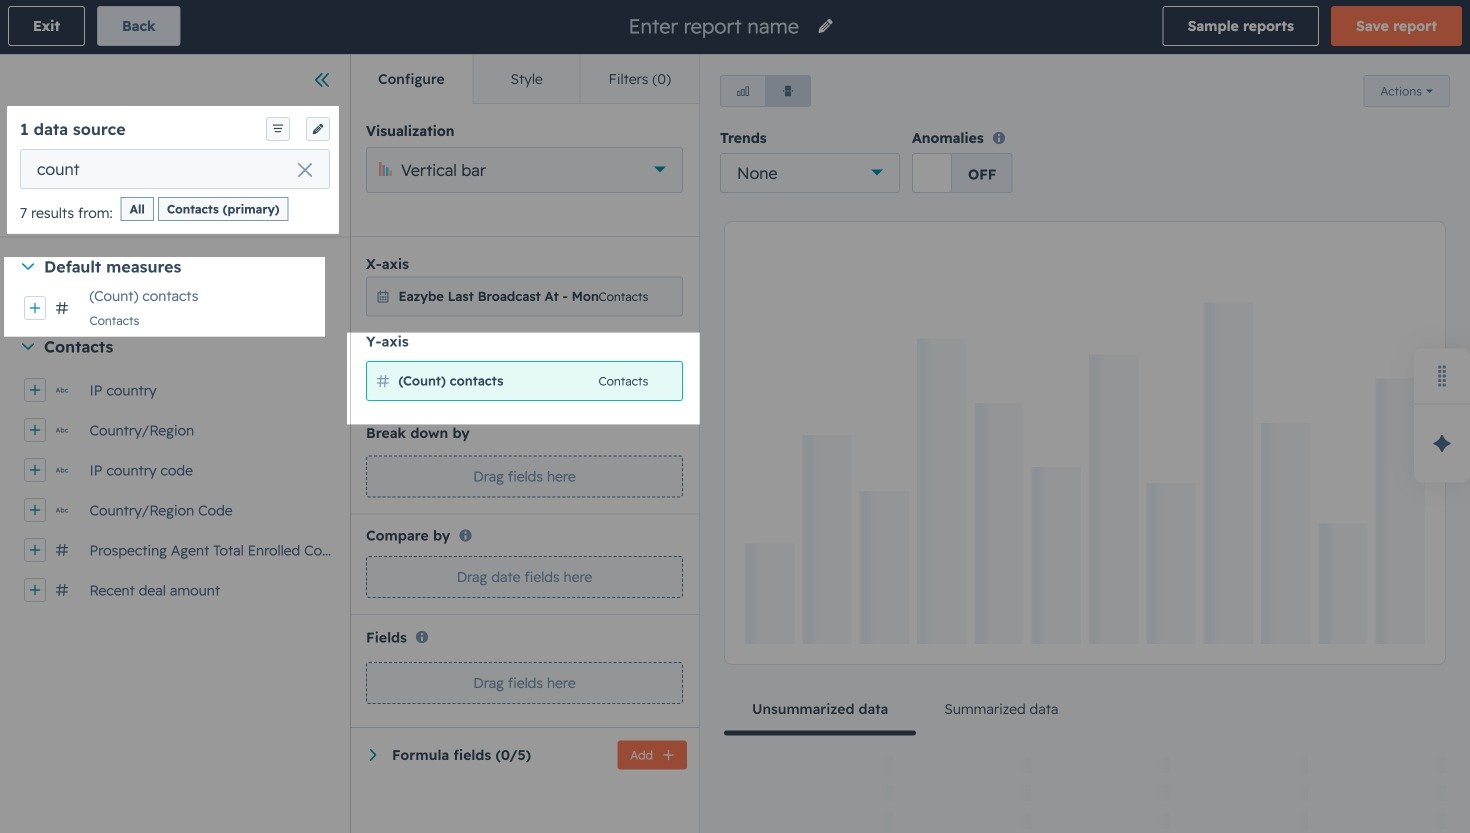
Set Count of contacts as the Y-axis for the failure-reasons report
Add the failure-reason breakdown
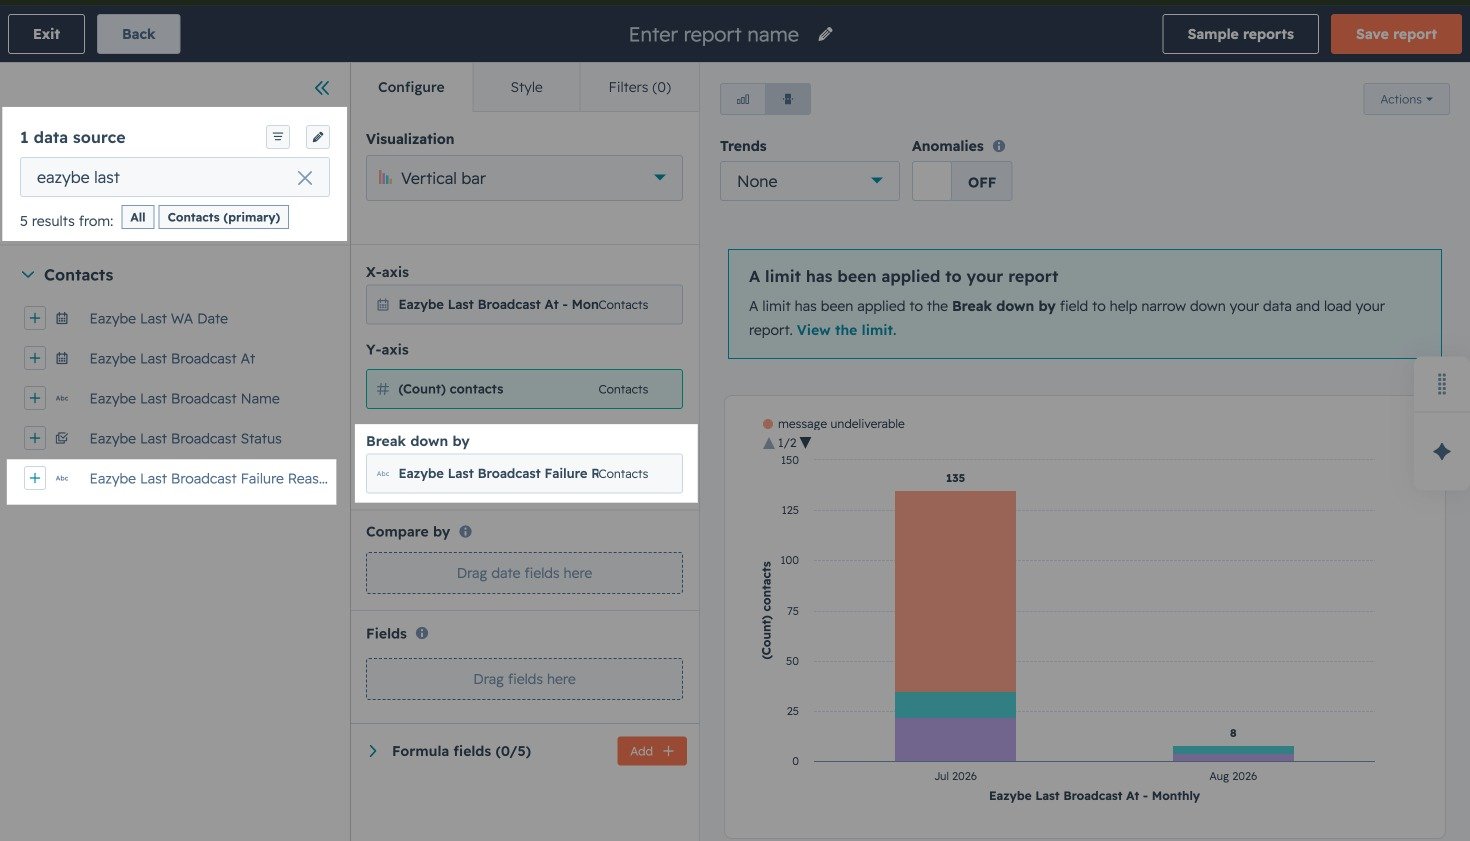
Break down the report by broadcast failure reason
Apply the failure filters
- Eazybe Last Broadcast Status is equal to Failed
- Eazybe Last Broadcast At is known
- Eazybe Last Broadcast Failure Reason is known
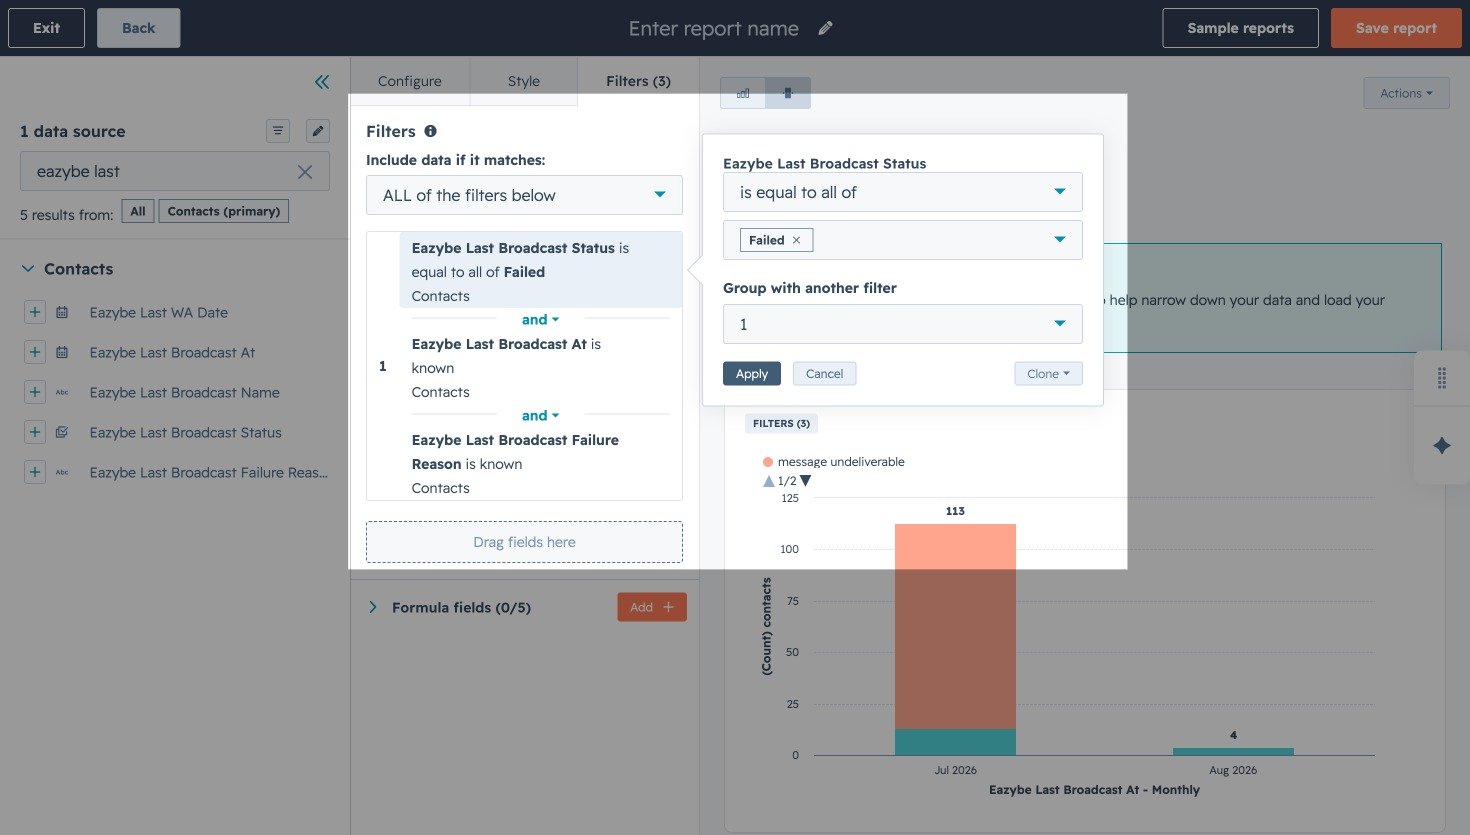
Apply the failure filters to the report
Save the report
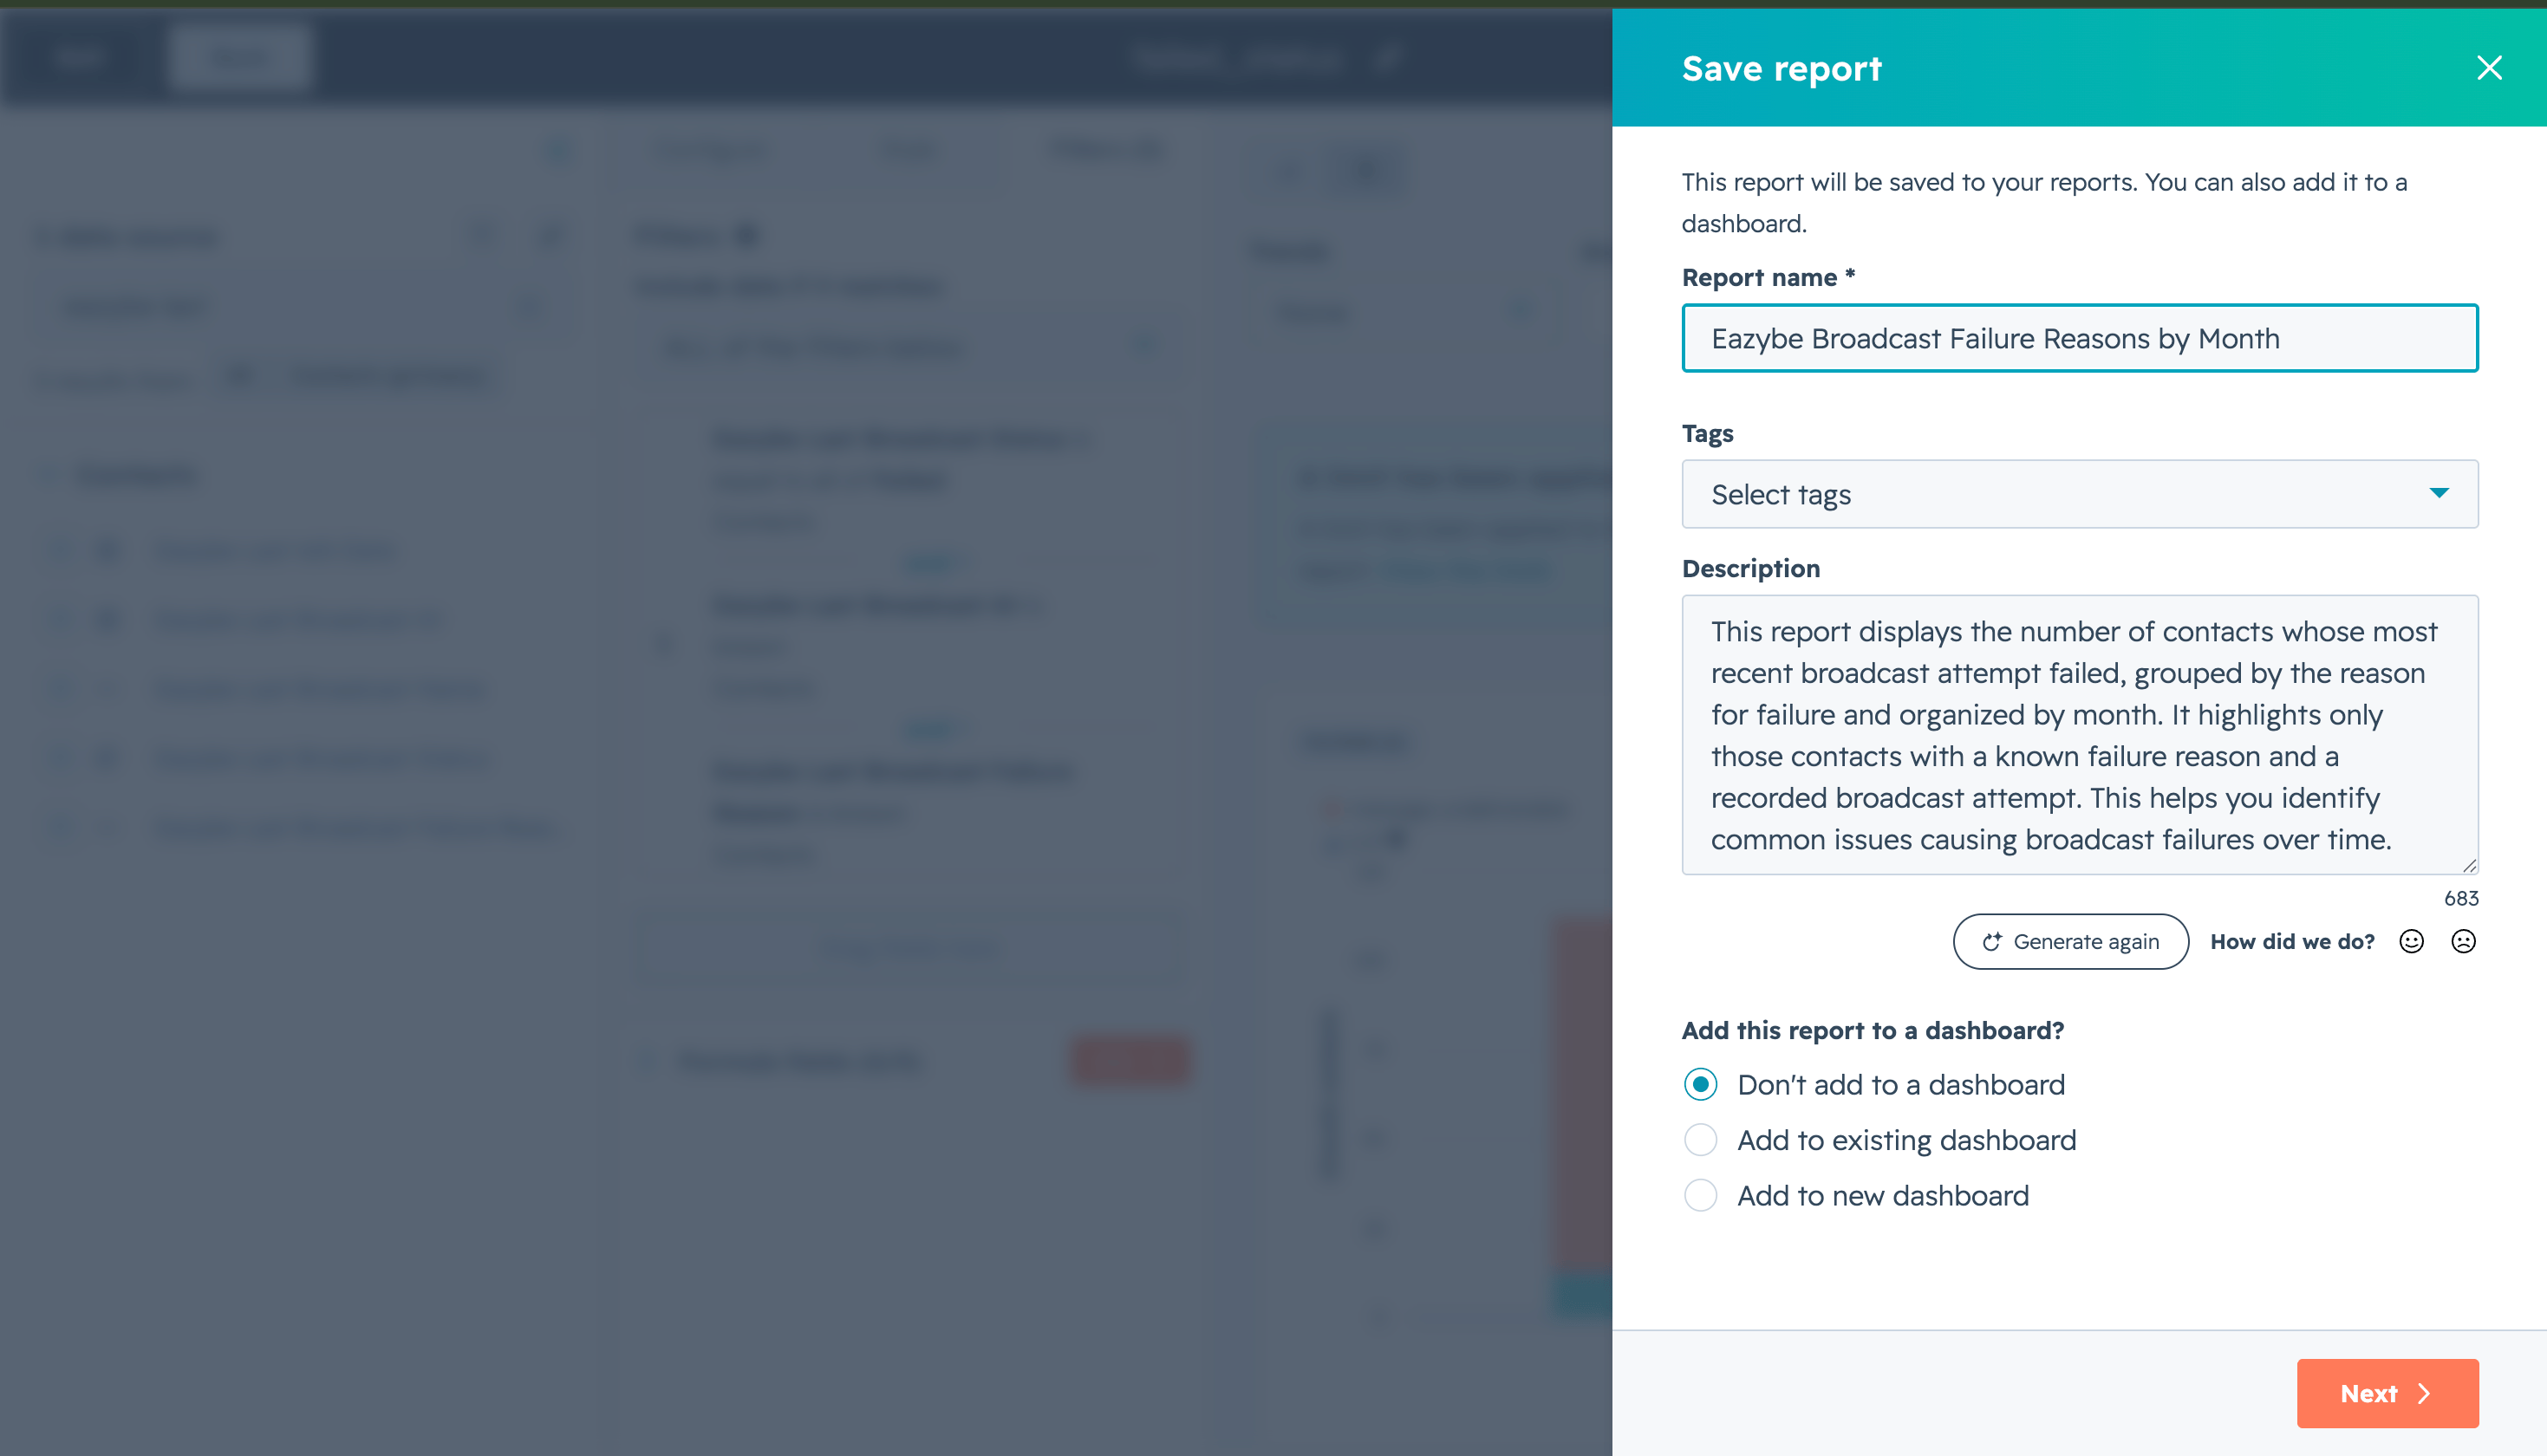
Save the broadcast failure-reasons report