

1
Choose the columns to show
In Campaign performance, open Columns. Check the fields you want to show and uncheck the ones you want to hide. Scroll inside the menu to reach options farther down, then click outside it to close it.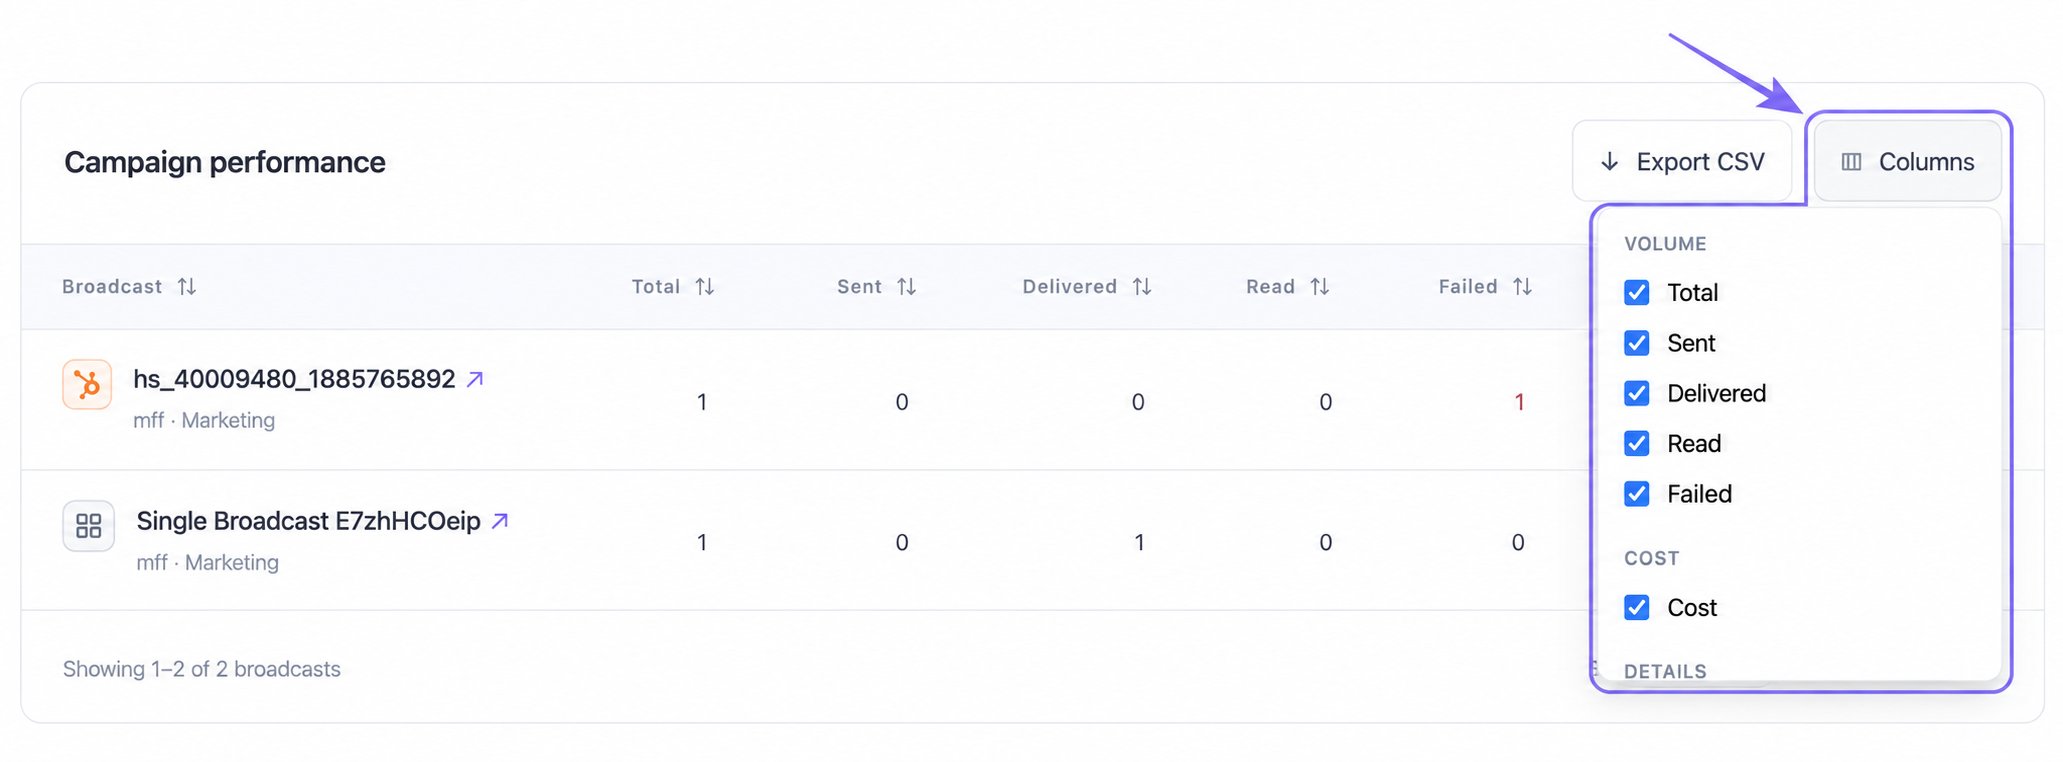
The first identifying column always stays visible, and at least one additional column must remain selected. Column choices are shared across the three views wherever the same field is available. They are remembered in this browser when browser storage is available; they are not a saved report shared with your team. Reset filters does not restore hidden columns; use Columns to show them again.
2
Sort and browse the results
Select a column heading to sort it in ascending order (↑): smaller numbers or earlier dates first, or names alphabetically. Select it again for descending order (↓): larger numbers, later dates, or reverse alphabetical order. The screenshot shows Failed sorted from highest to lowest, with only Total, Failed, and Cost selected alongside the campaign name.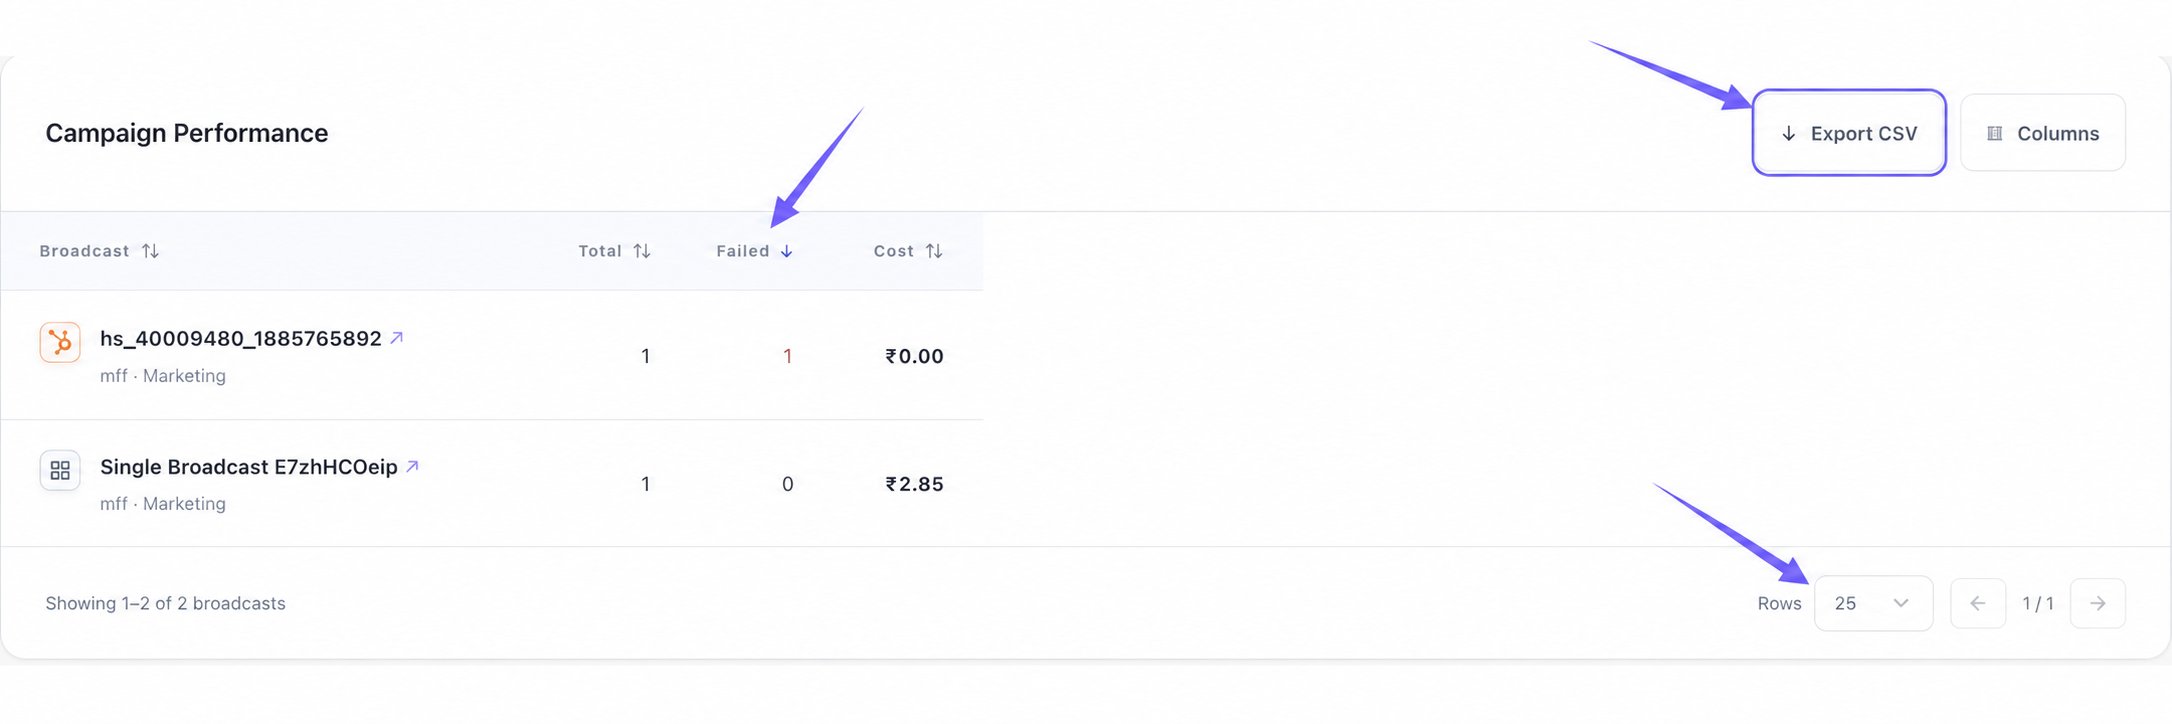
In Broadcast view, sorting orders the currently loaded campaign rows. In Template and Number views, sorting applies to the loaded summary before it is split into pages.
3
Download the CSV
Select Export CSV above the table. The download uses the current grouping, selected columns, and sort order. The first identifying column is always included. The file name starts with
broadcast-analytics-, followed by the view and export date, and ends in .csv.In Number view, the first exported column contains the sender’s displayed name, or its phone number when no name is available. The phone-number line shown underneath a sender’s name is not exported as a separate column.Which Export Do You Need?
The summary CSV contains the table’s selected columns. It does not include the message preview, recipient phone list, or individual failure reasons. See View Broadcast Analytics for those details.