> ## Documentation Index
> Fetch the complete documentation index at: https://help.eazybe.com/llms.txt
> Use this file to discover all available pages before exploring further.
# Create Eazybe Broadcast Reports in HubSpot
> Create success, failure-reason, and complete broadcast reports using Eazybe contact properties.
Use this guide to create three client-ready HubSpot reports from these Eazybe contact properties:
* **Eazybe Last Broadcast Status**
* **Eazybe Last Broadcast Name**
* **Eazybe Last Broadcast Failure Reason**
* **Eazybe Last Broadcast At**
## Open the HubSpot report builder
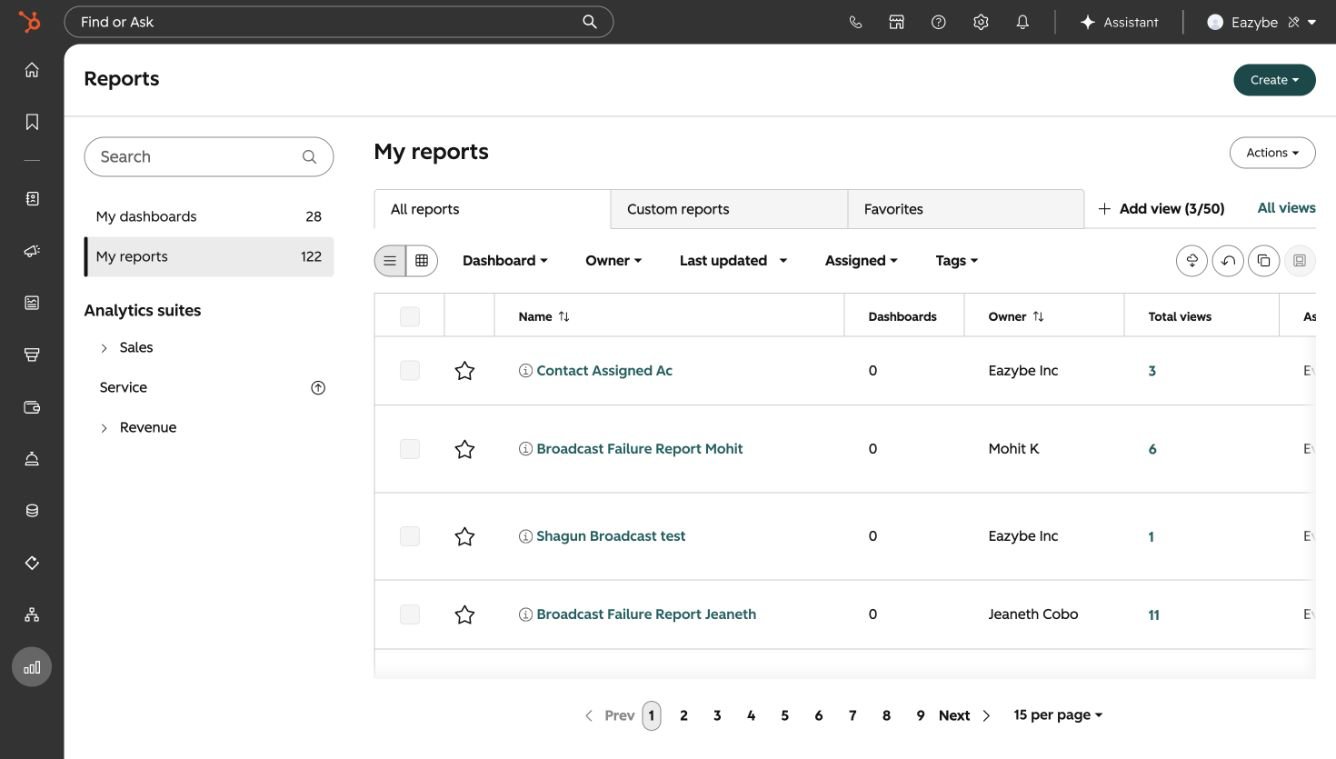
In your HubSpot account, click the **Reporting** icon in the left navigation, then select **Reports**.
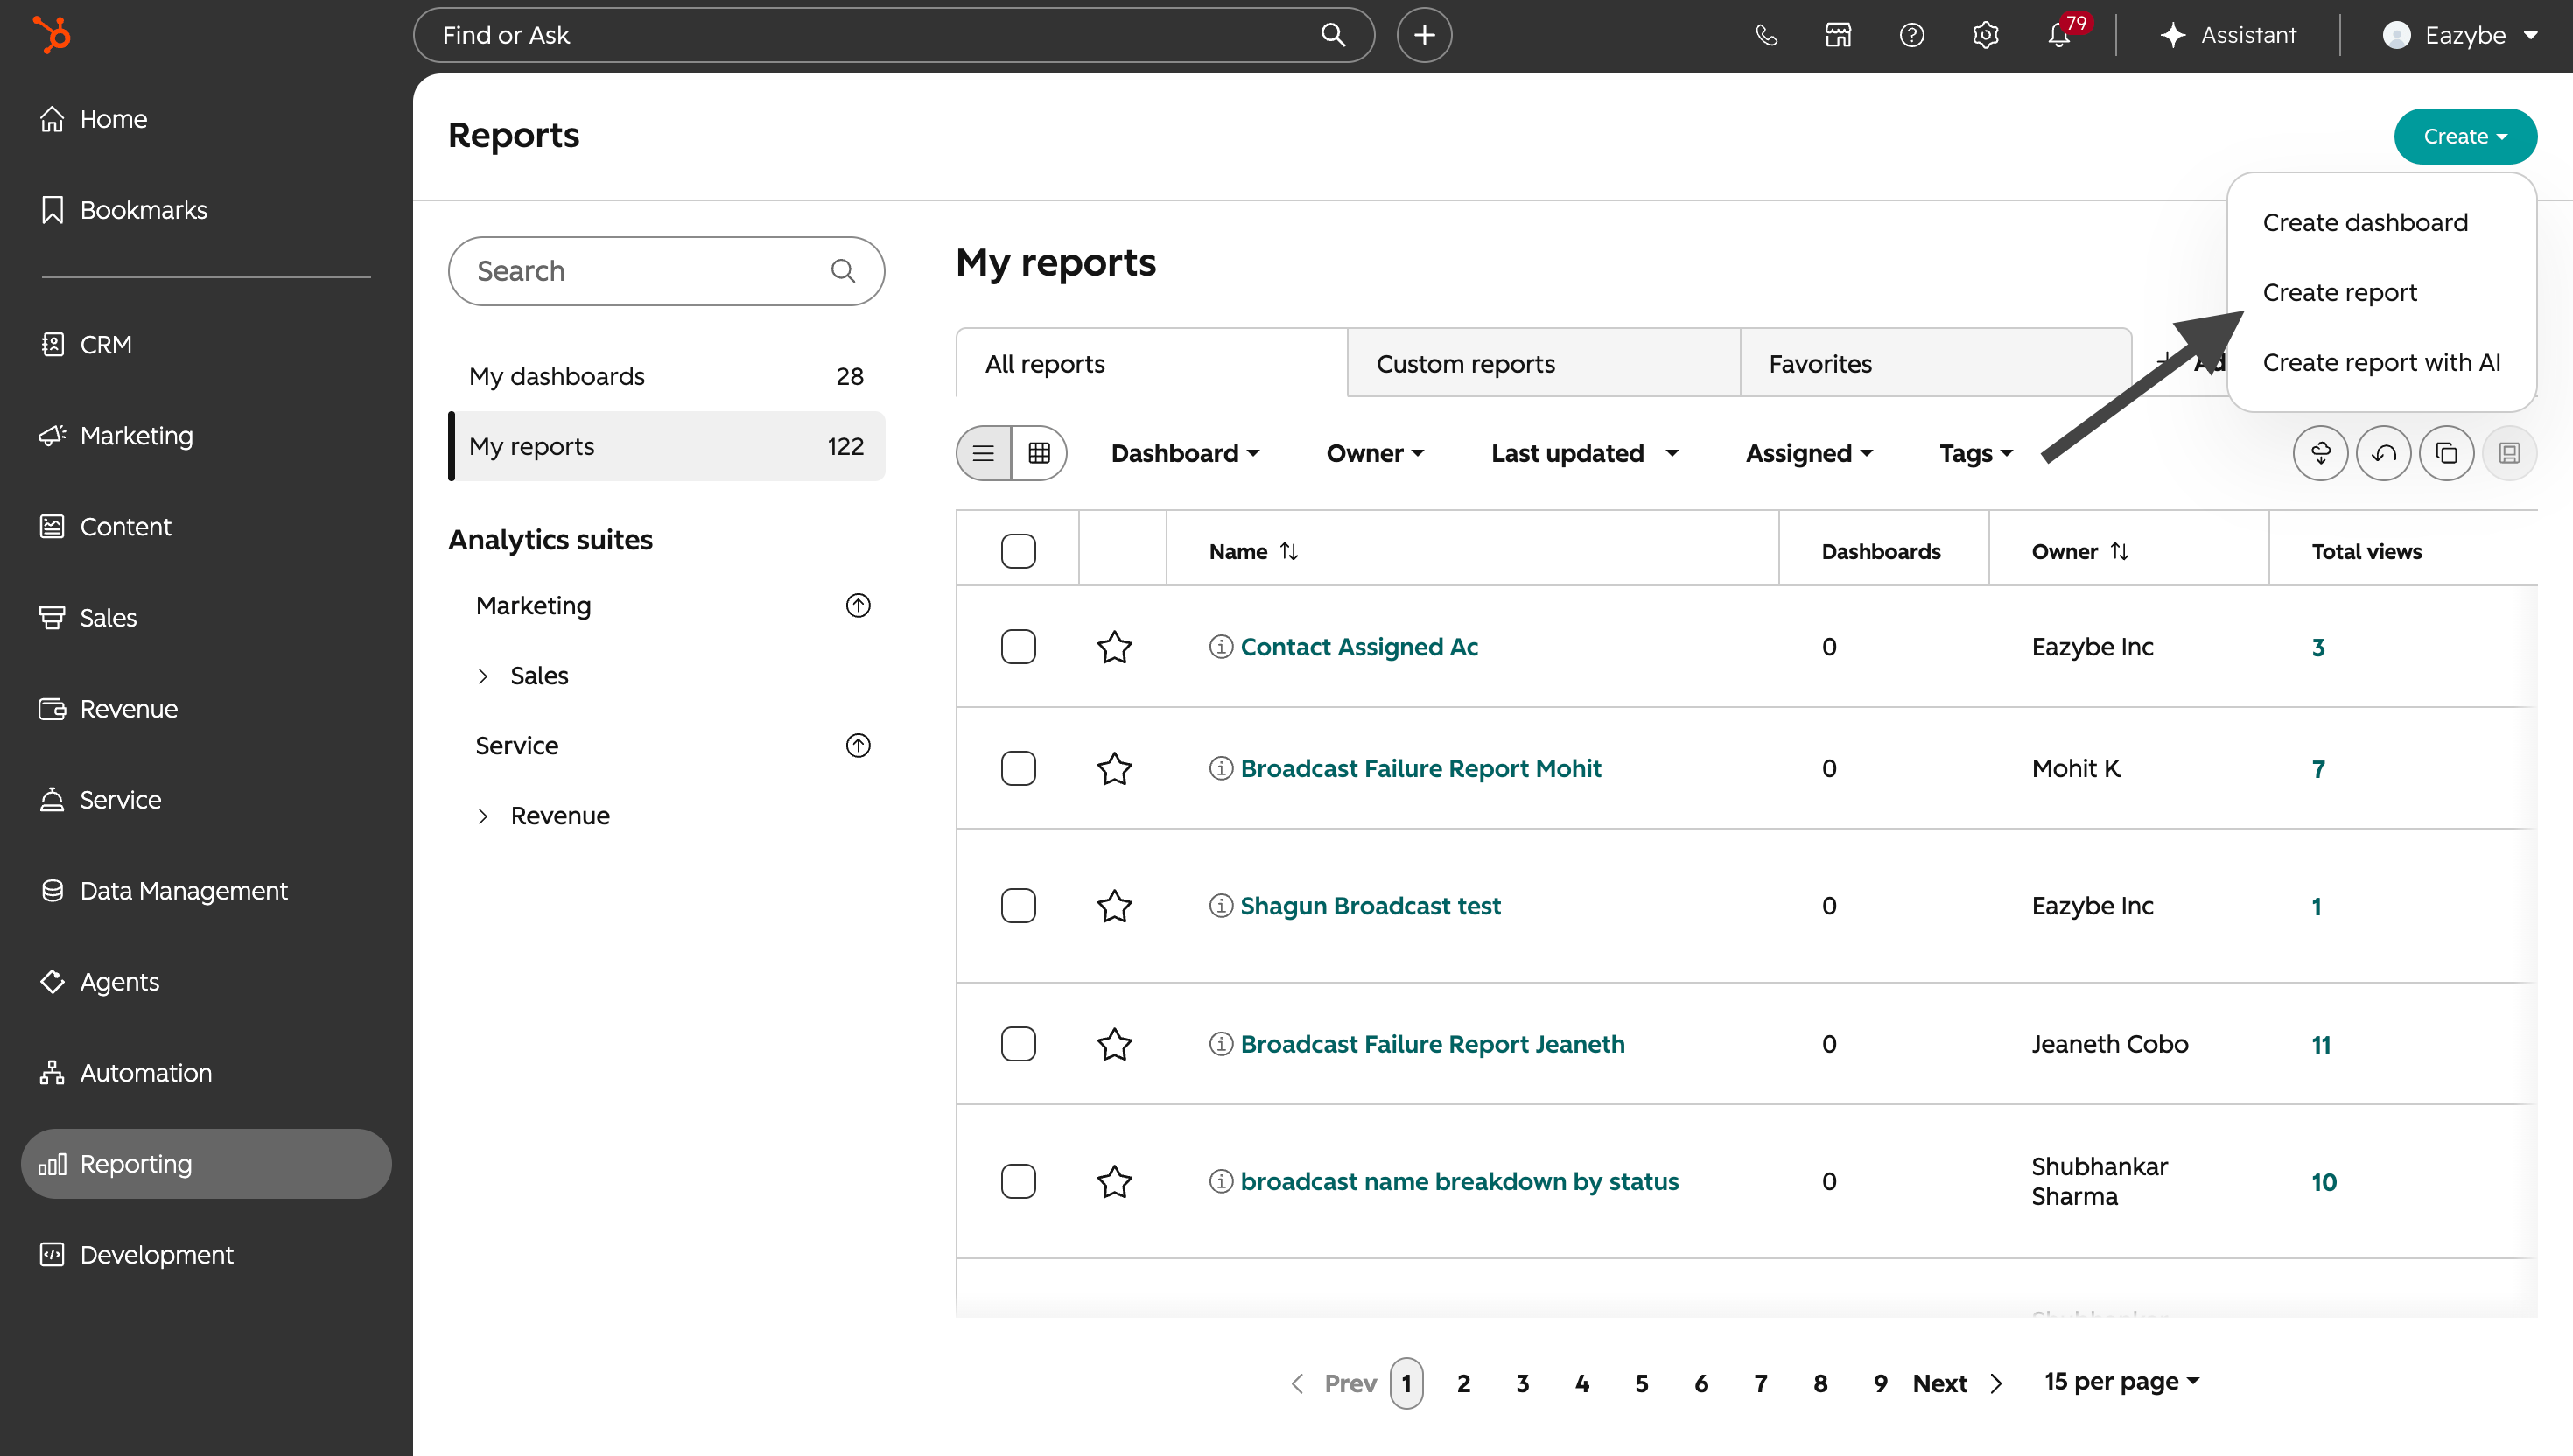
 Click **Create** in the upper-right corner, then select **Create report**.
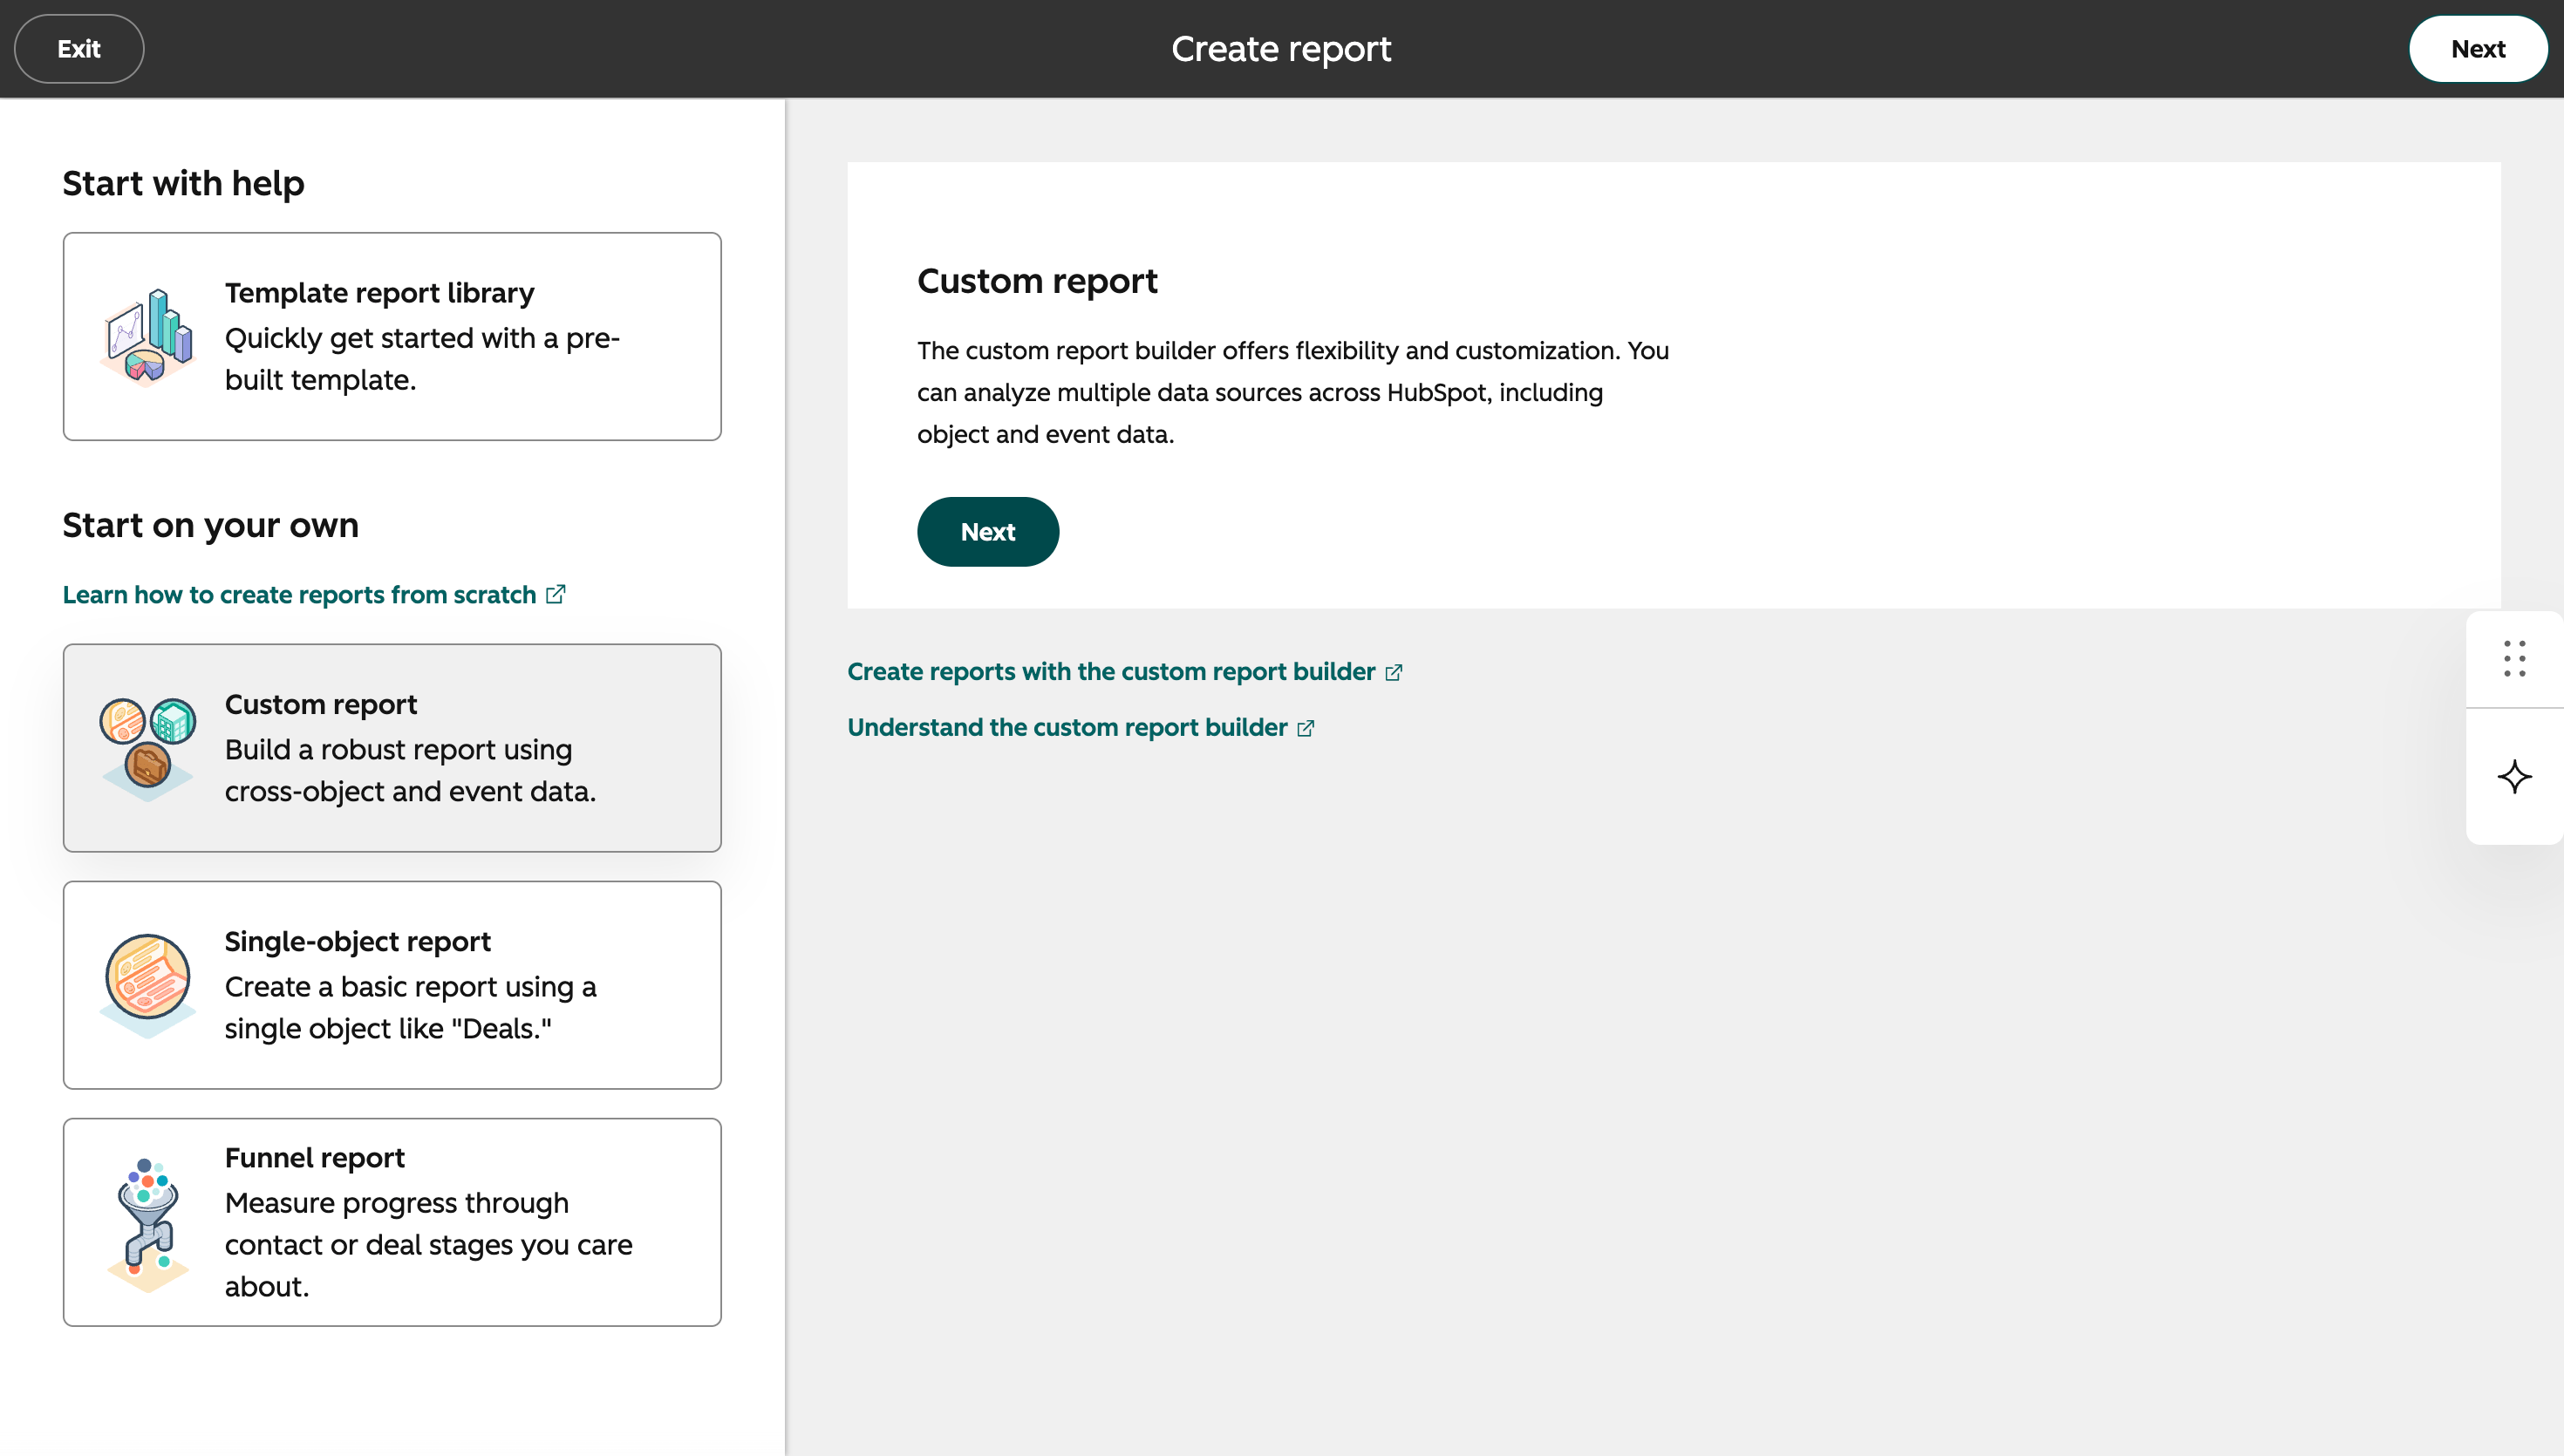
 Select **Custom report builder**, then click **Next**.
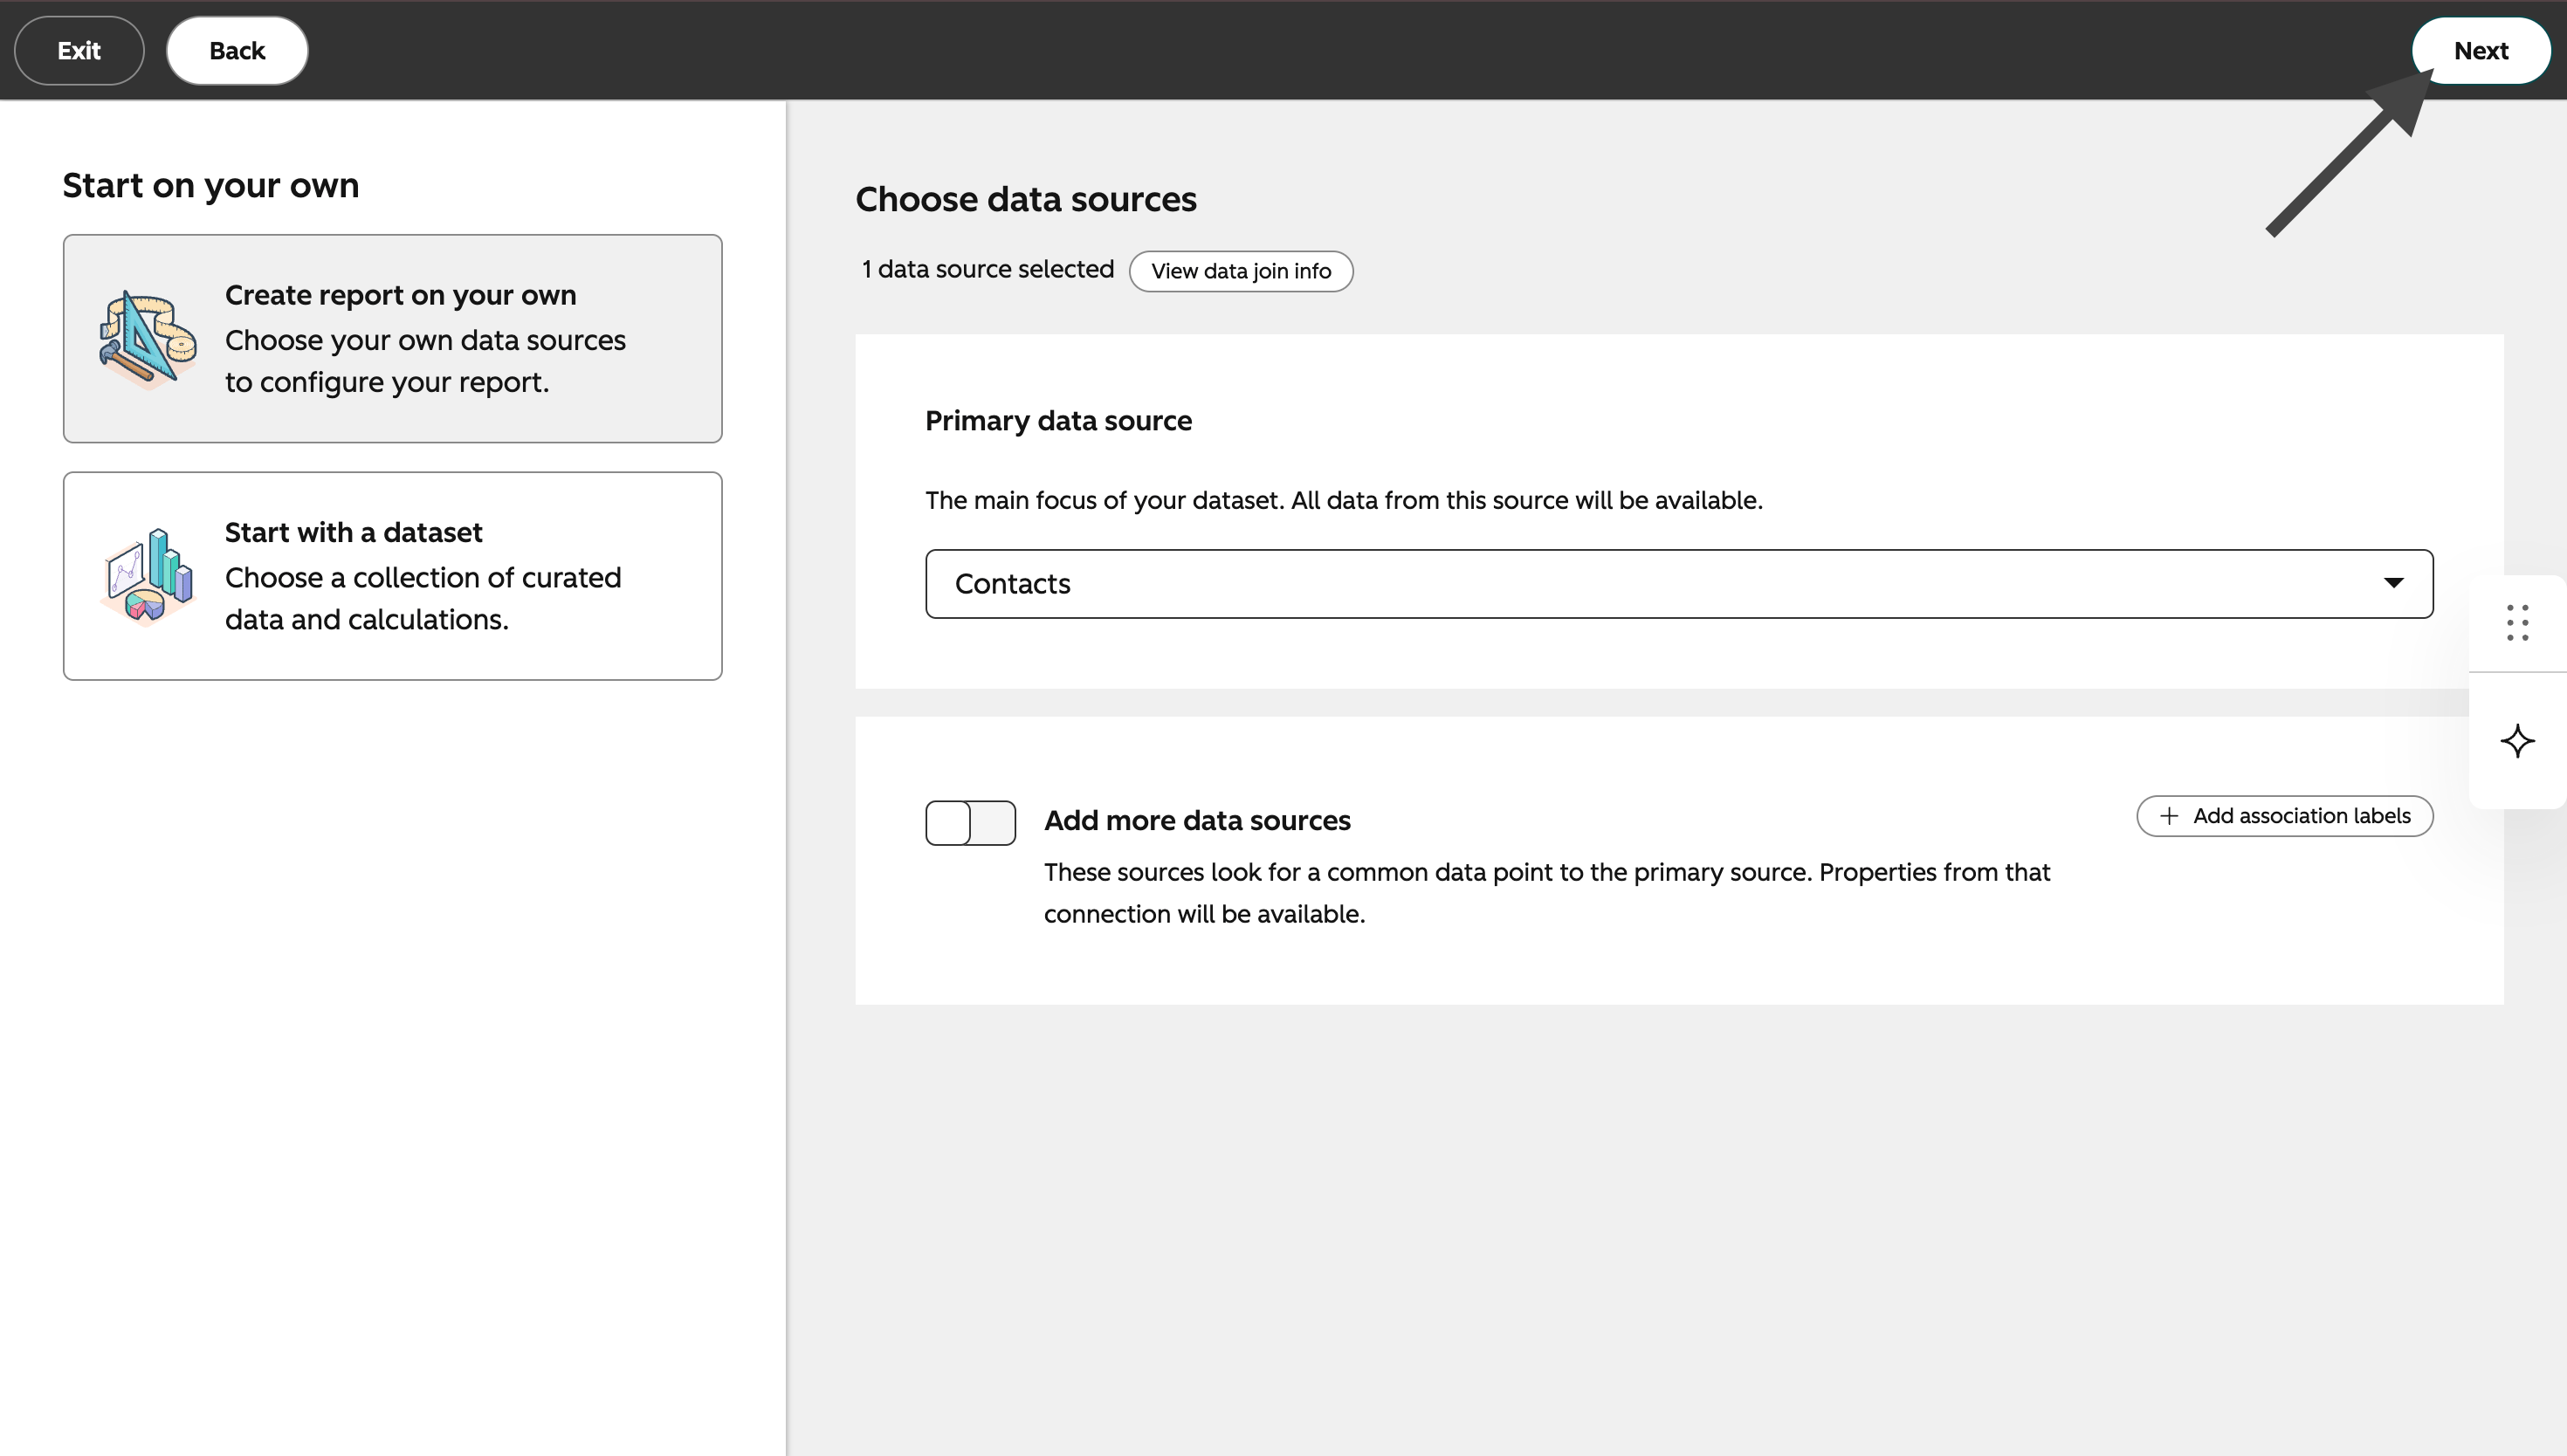
 Select **Contacts** as the primary data source, then click **Next**.
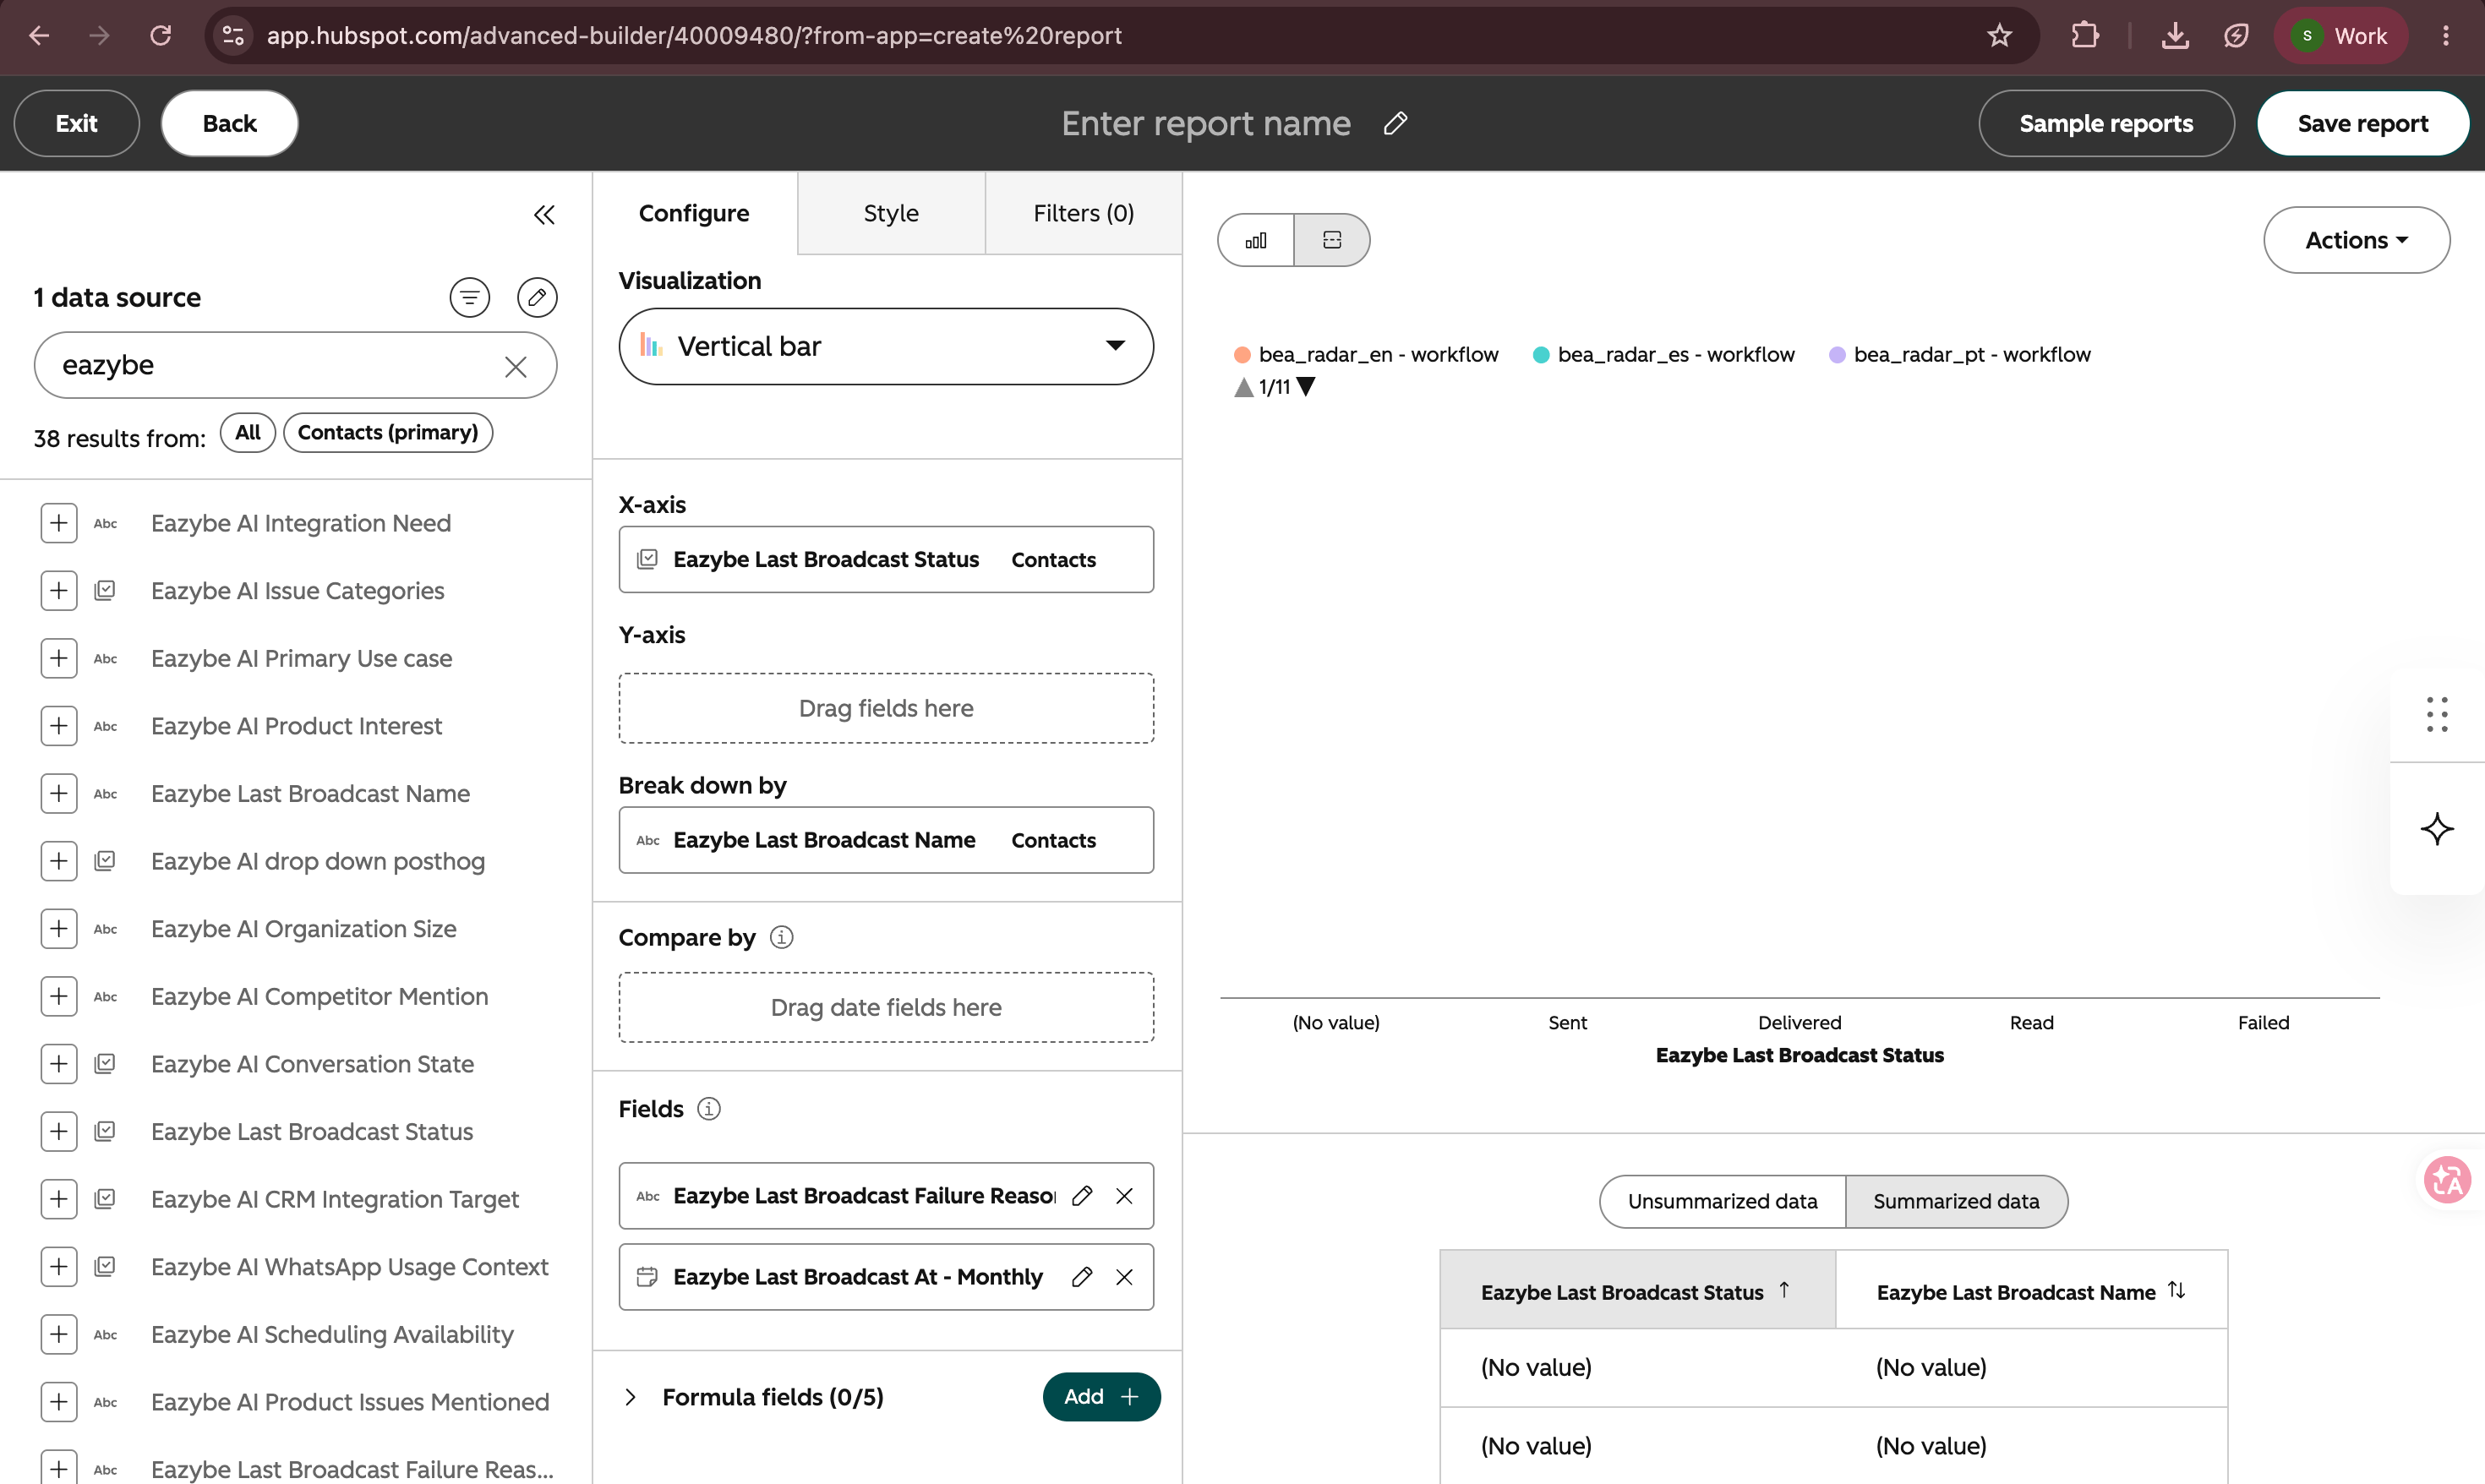
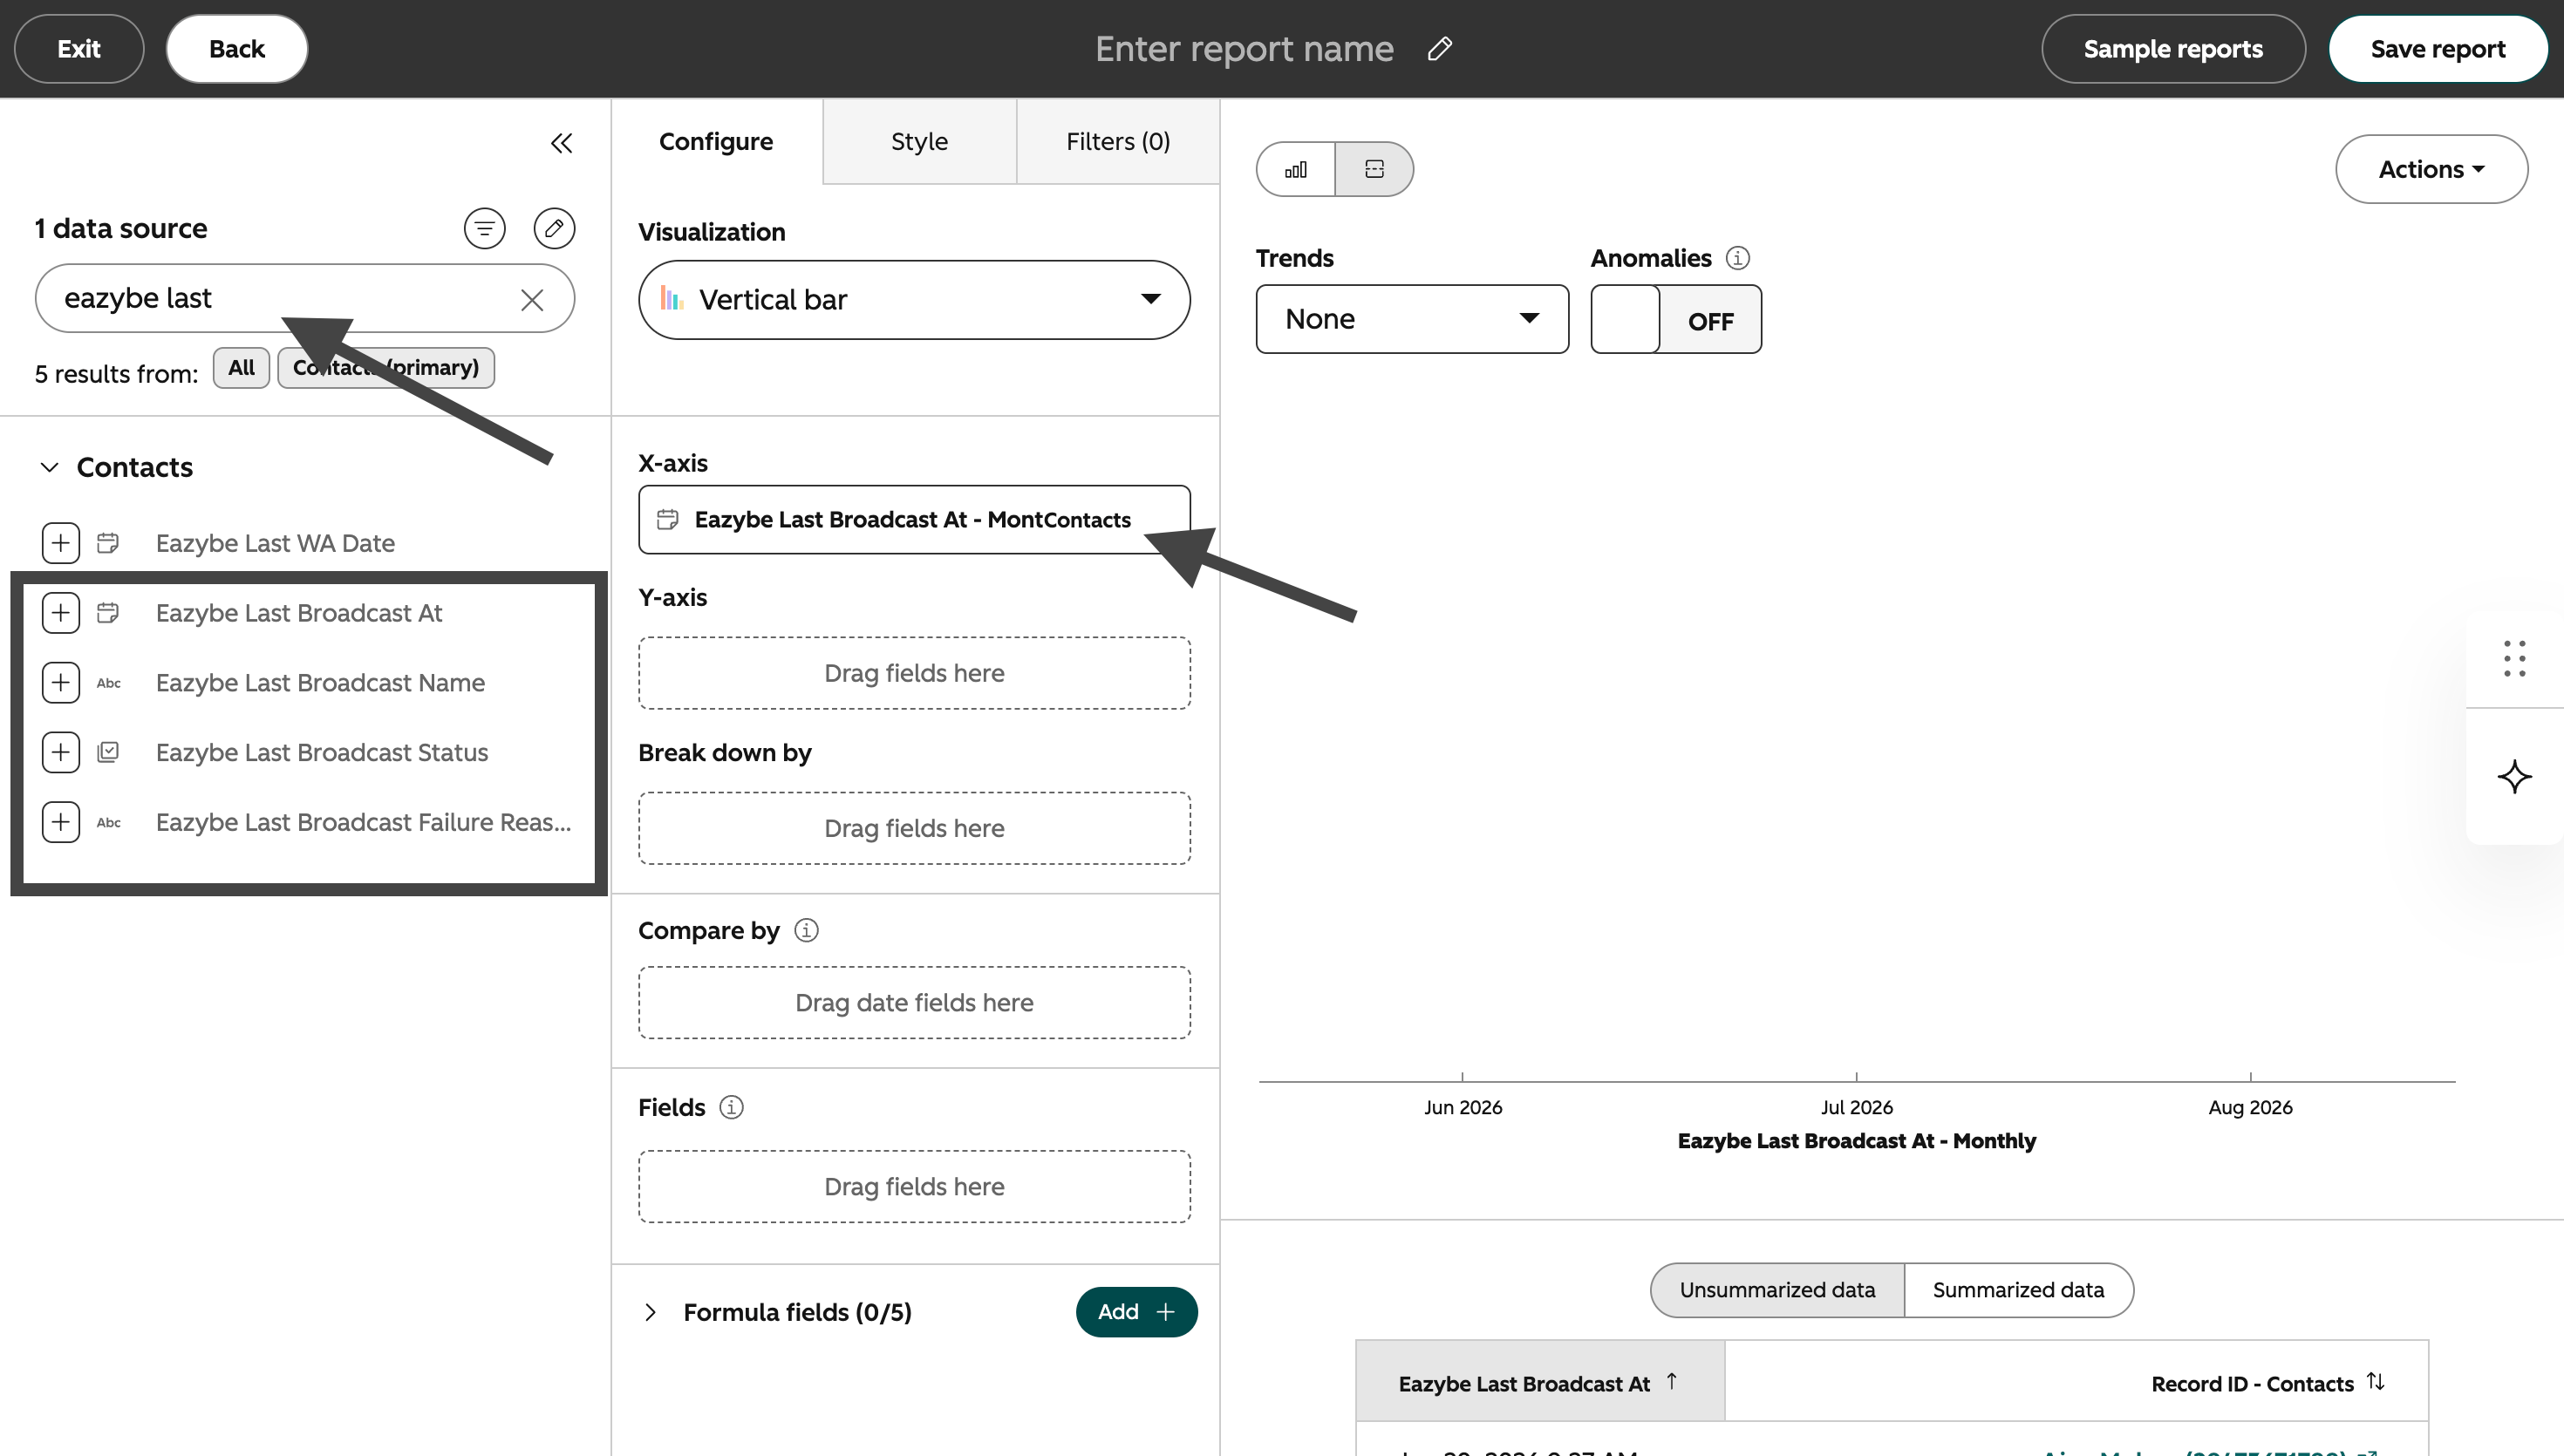
 In the search field, enter **Eazybe Last Broadcast**. The four Eazybe properties will appear in the field list.
 ## Report 1: Broadcast success by month
This report shows how many contacts had a successful broadcast result each month.
Under **Visualization**, select **Vertical bar**.
## Report 1: Broadcast success by month
This report shows how many contacts had a successful broadcast result each month.
Under **Visualization**, select **Vertical bar**.
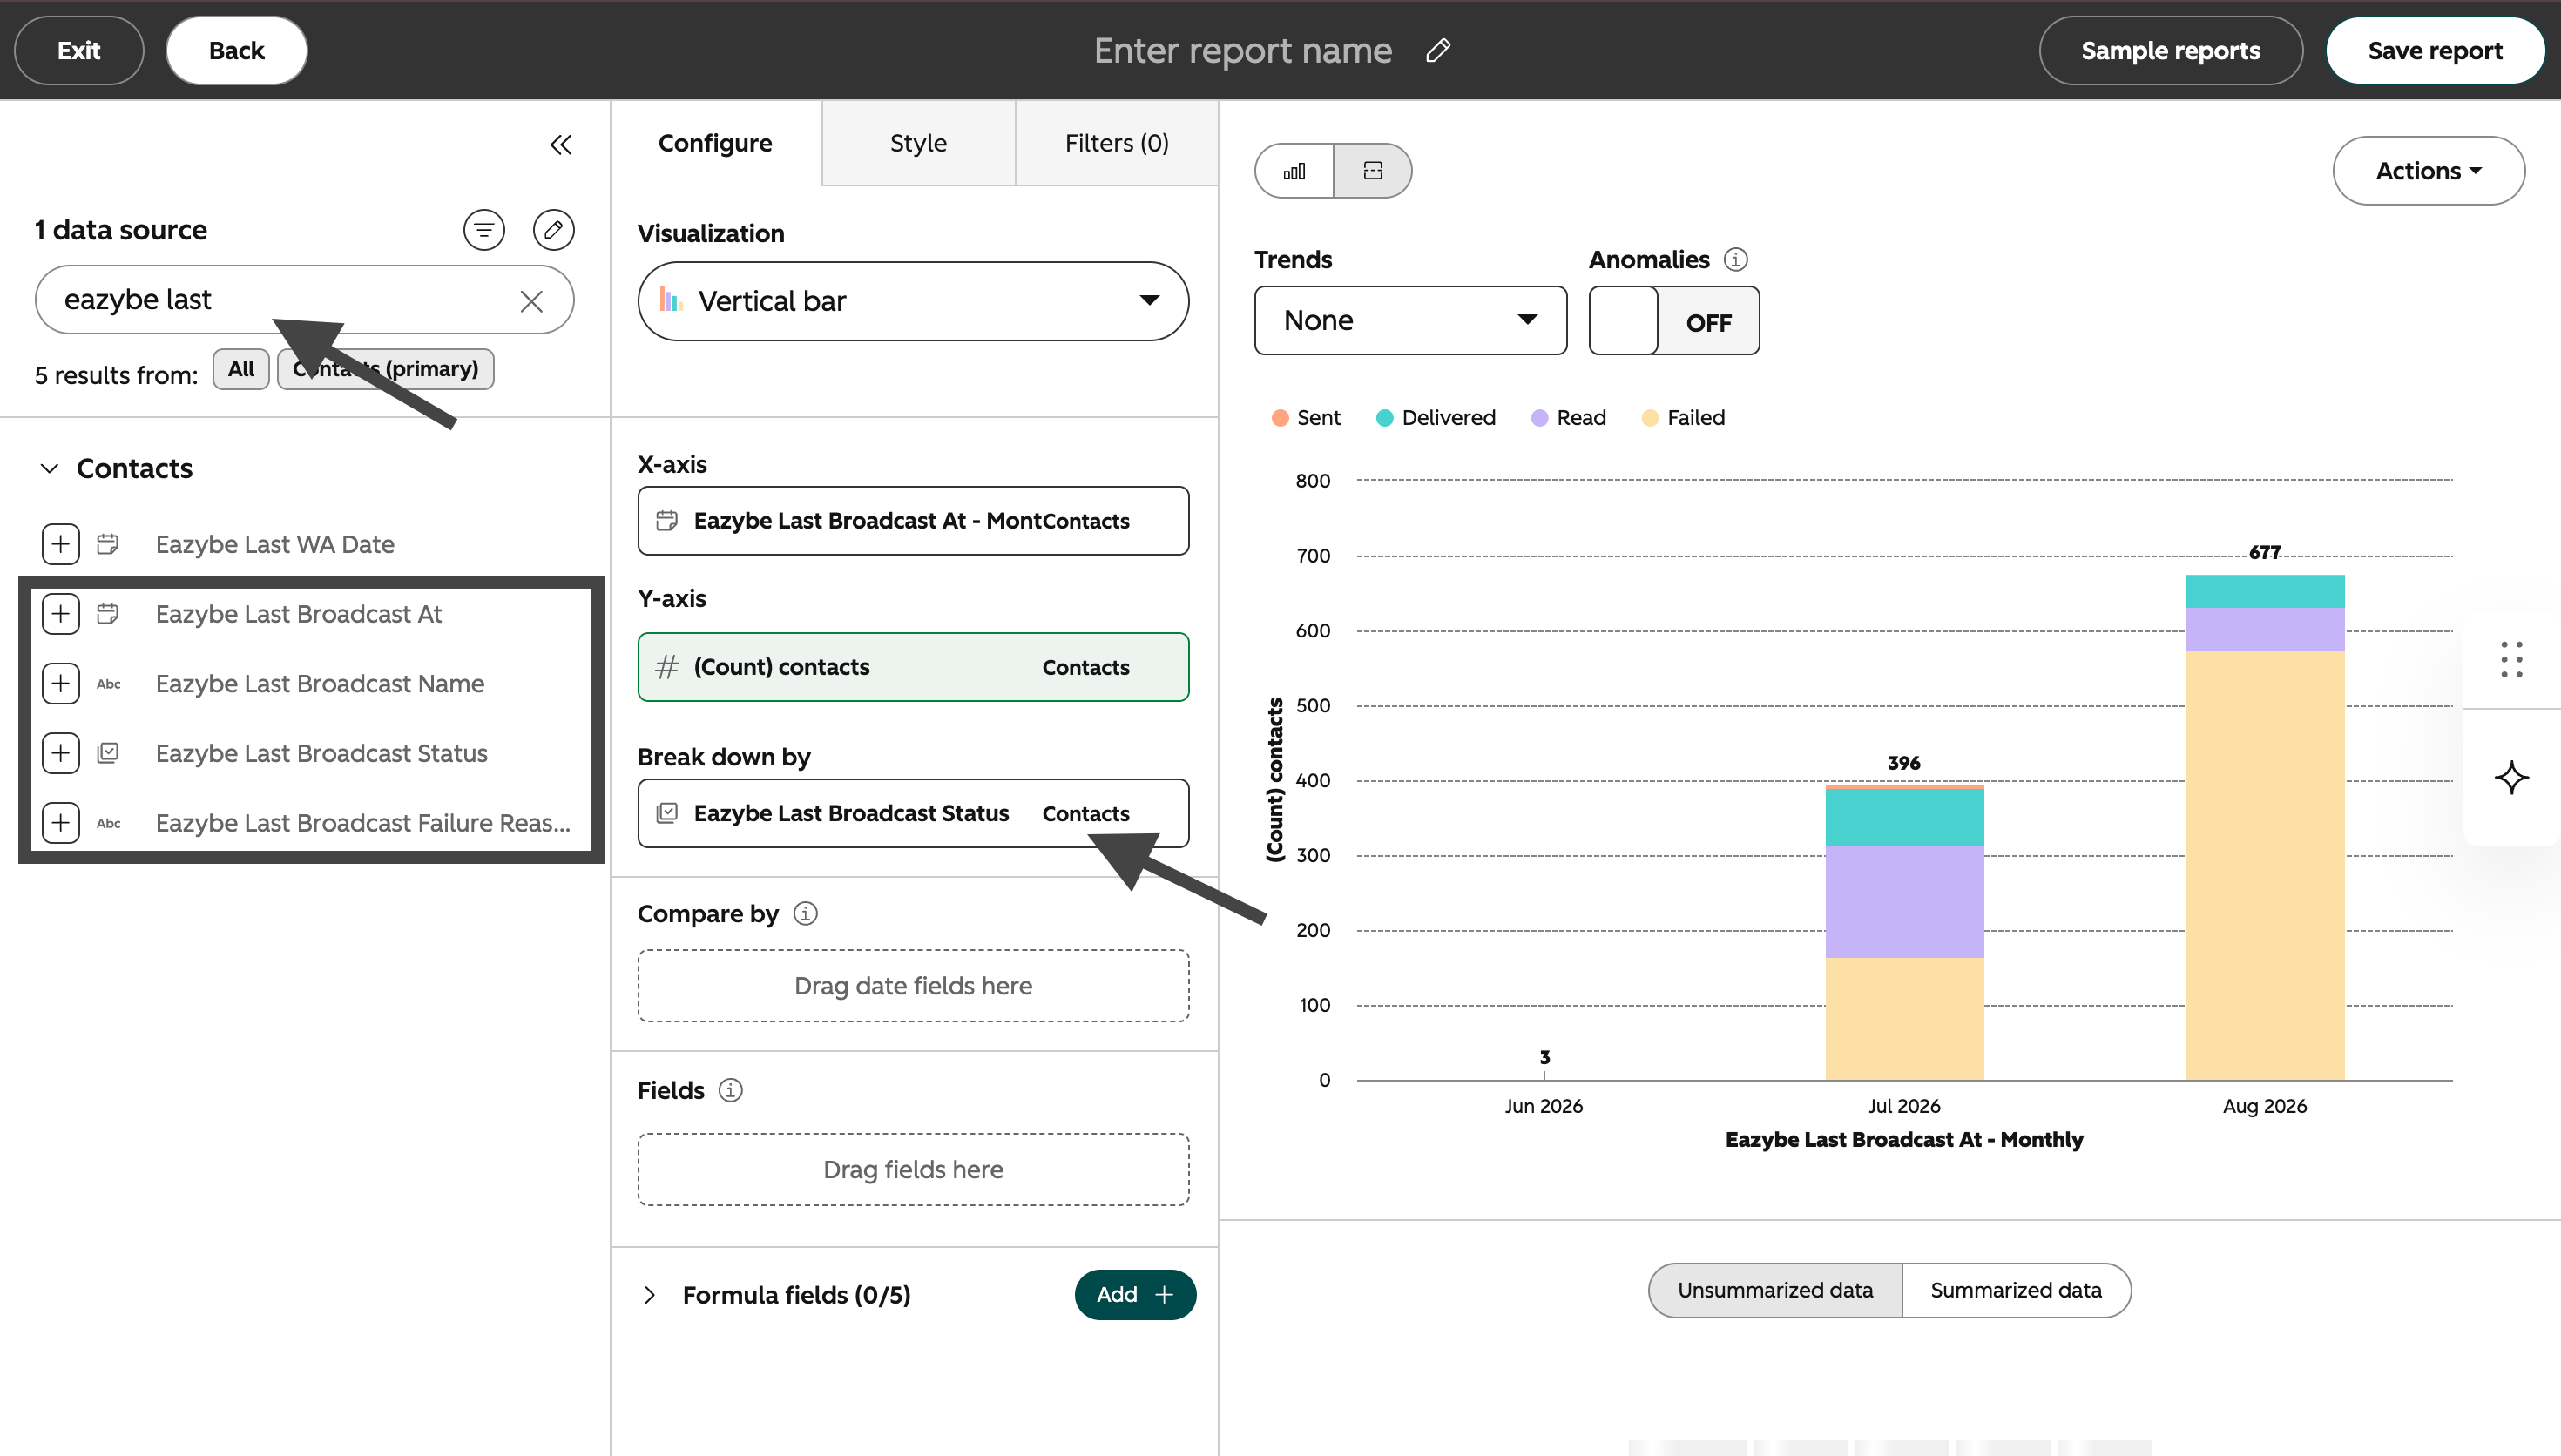
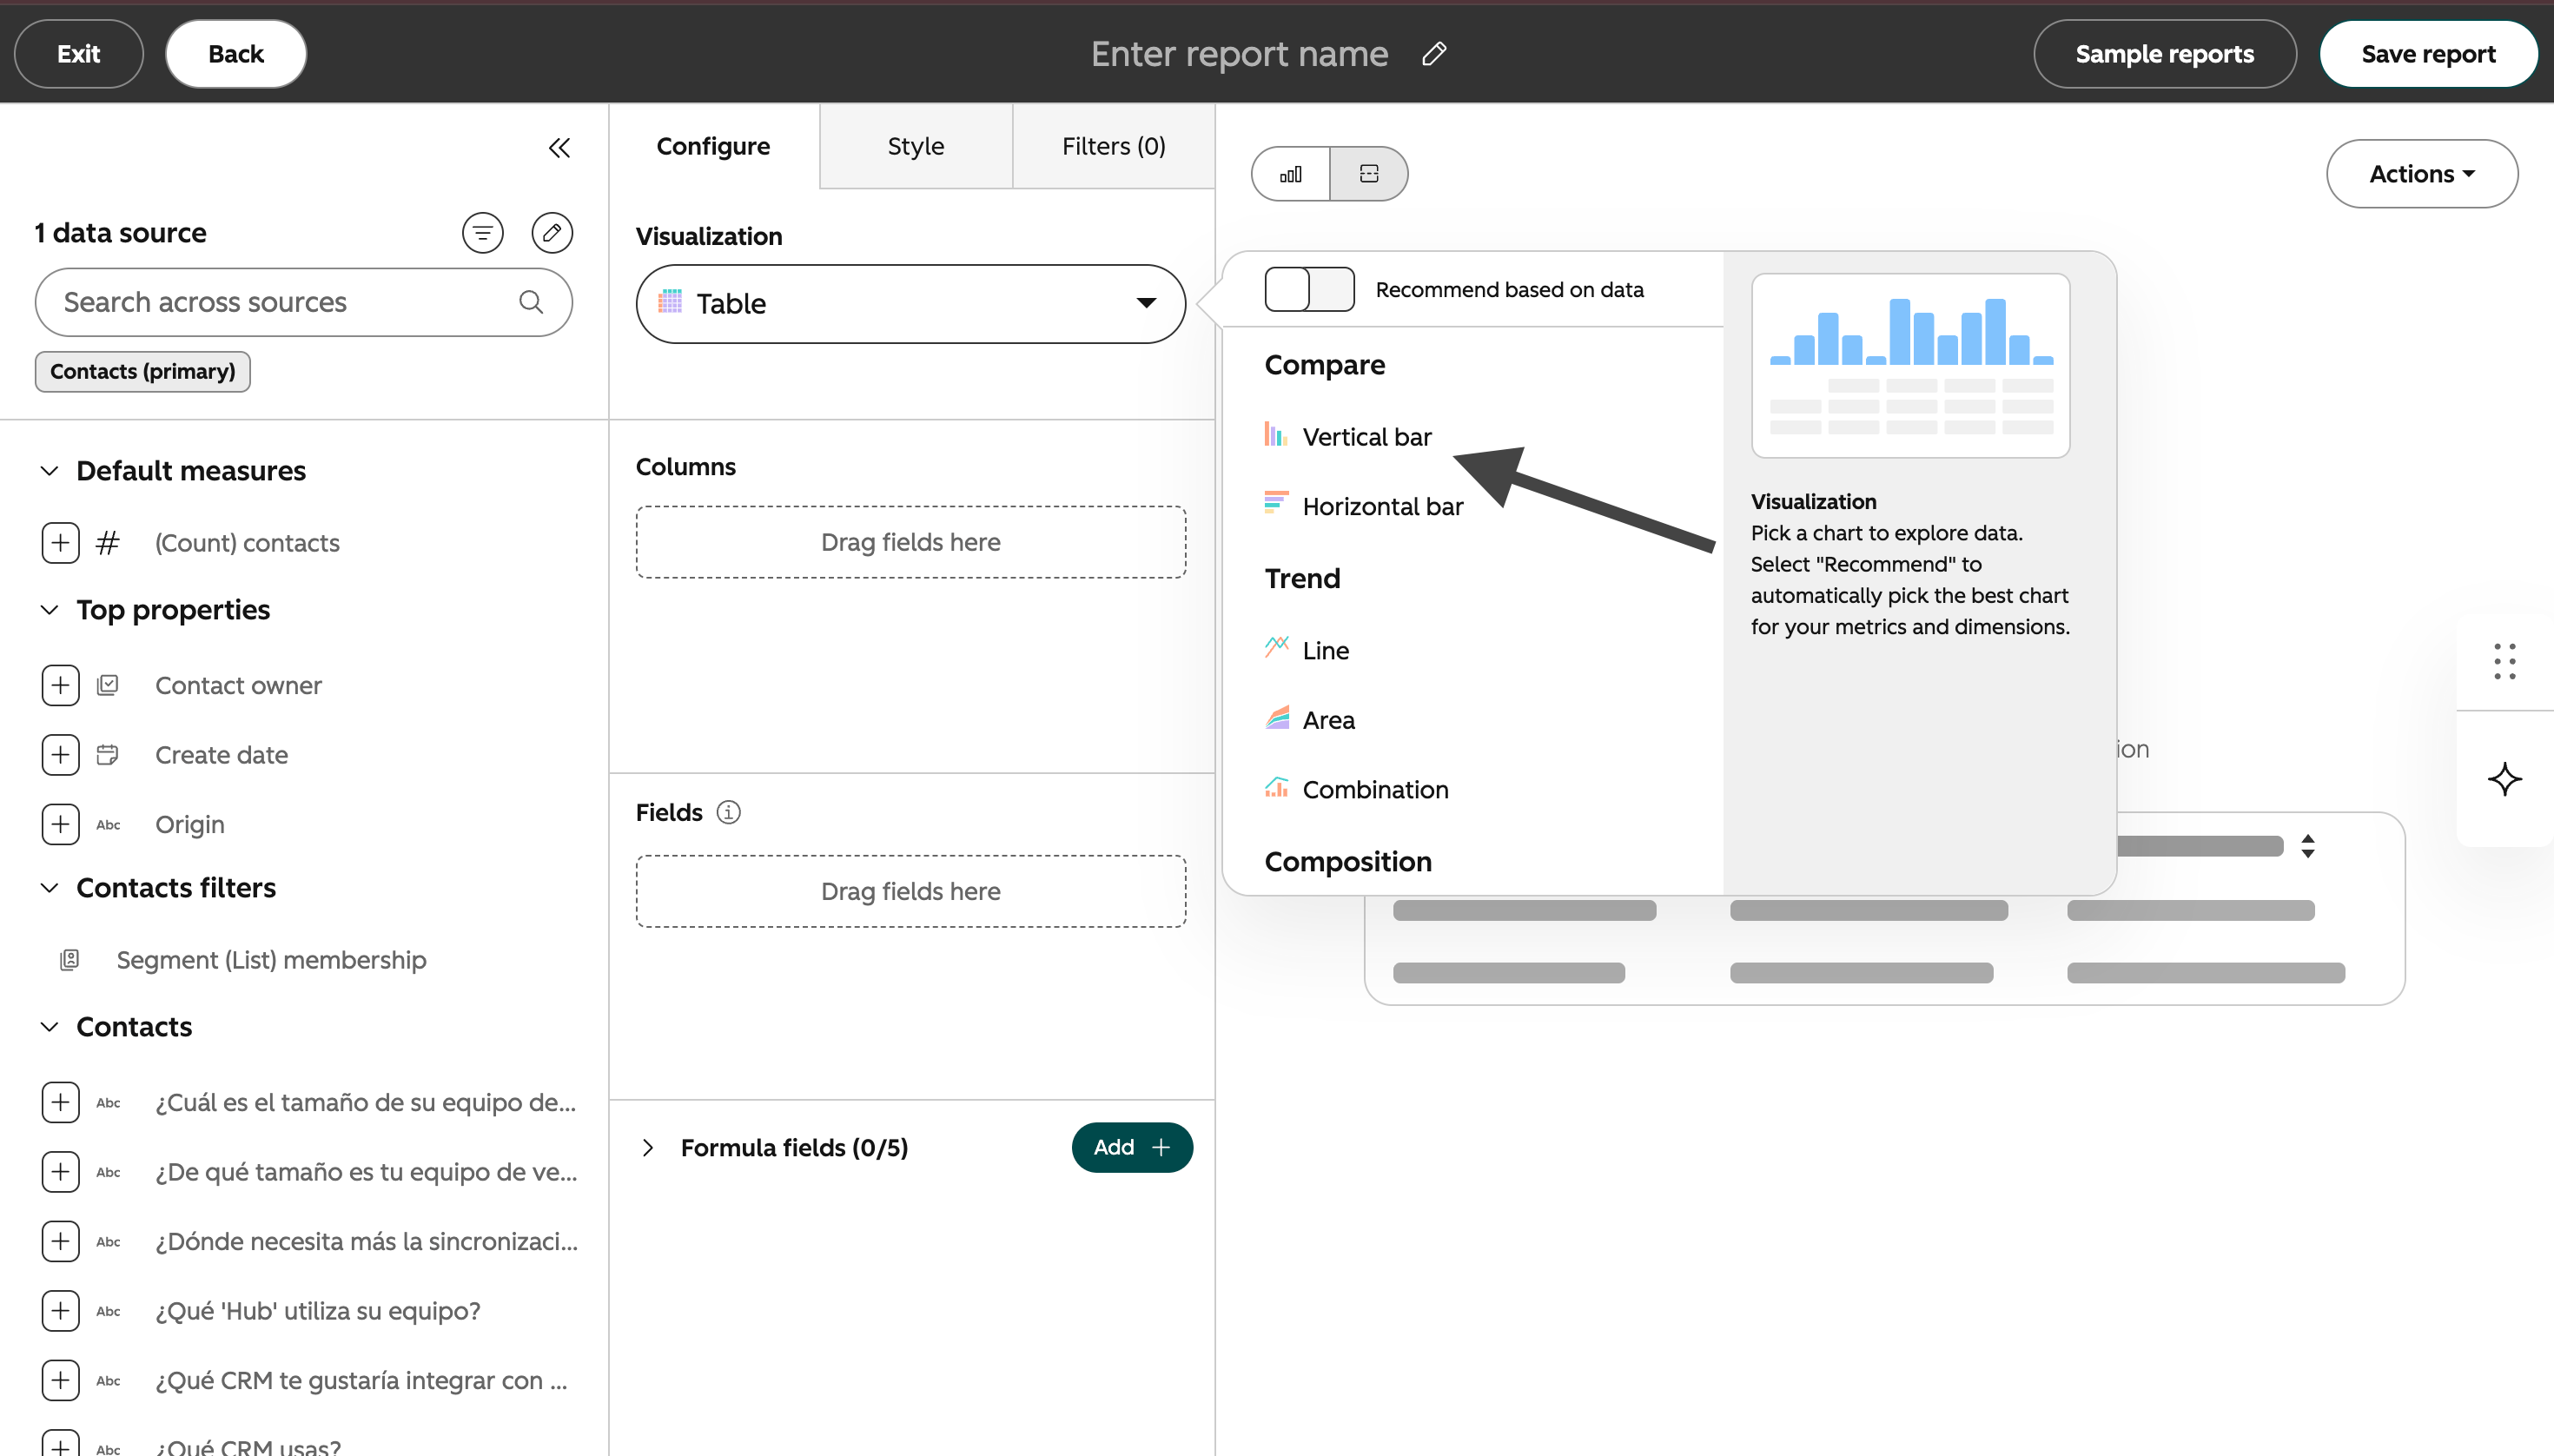 Drag **Eazybe Last Broadcast At** to the **X-axis**. Click the edit icon beside the field and select **Monthly** as the frequency.
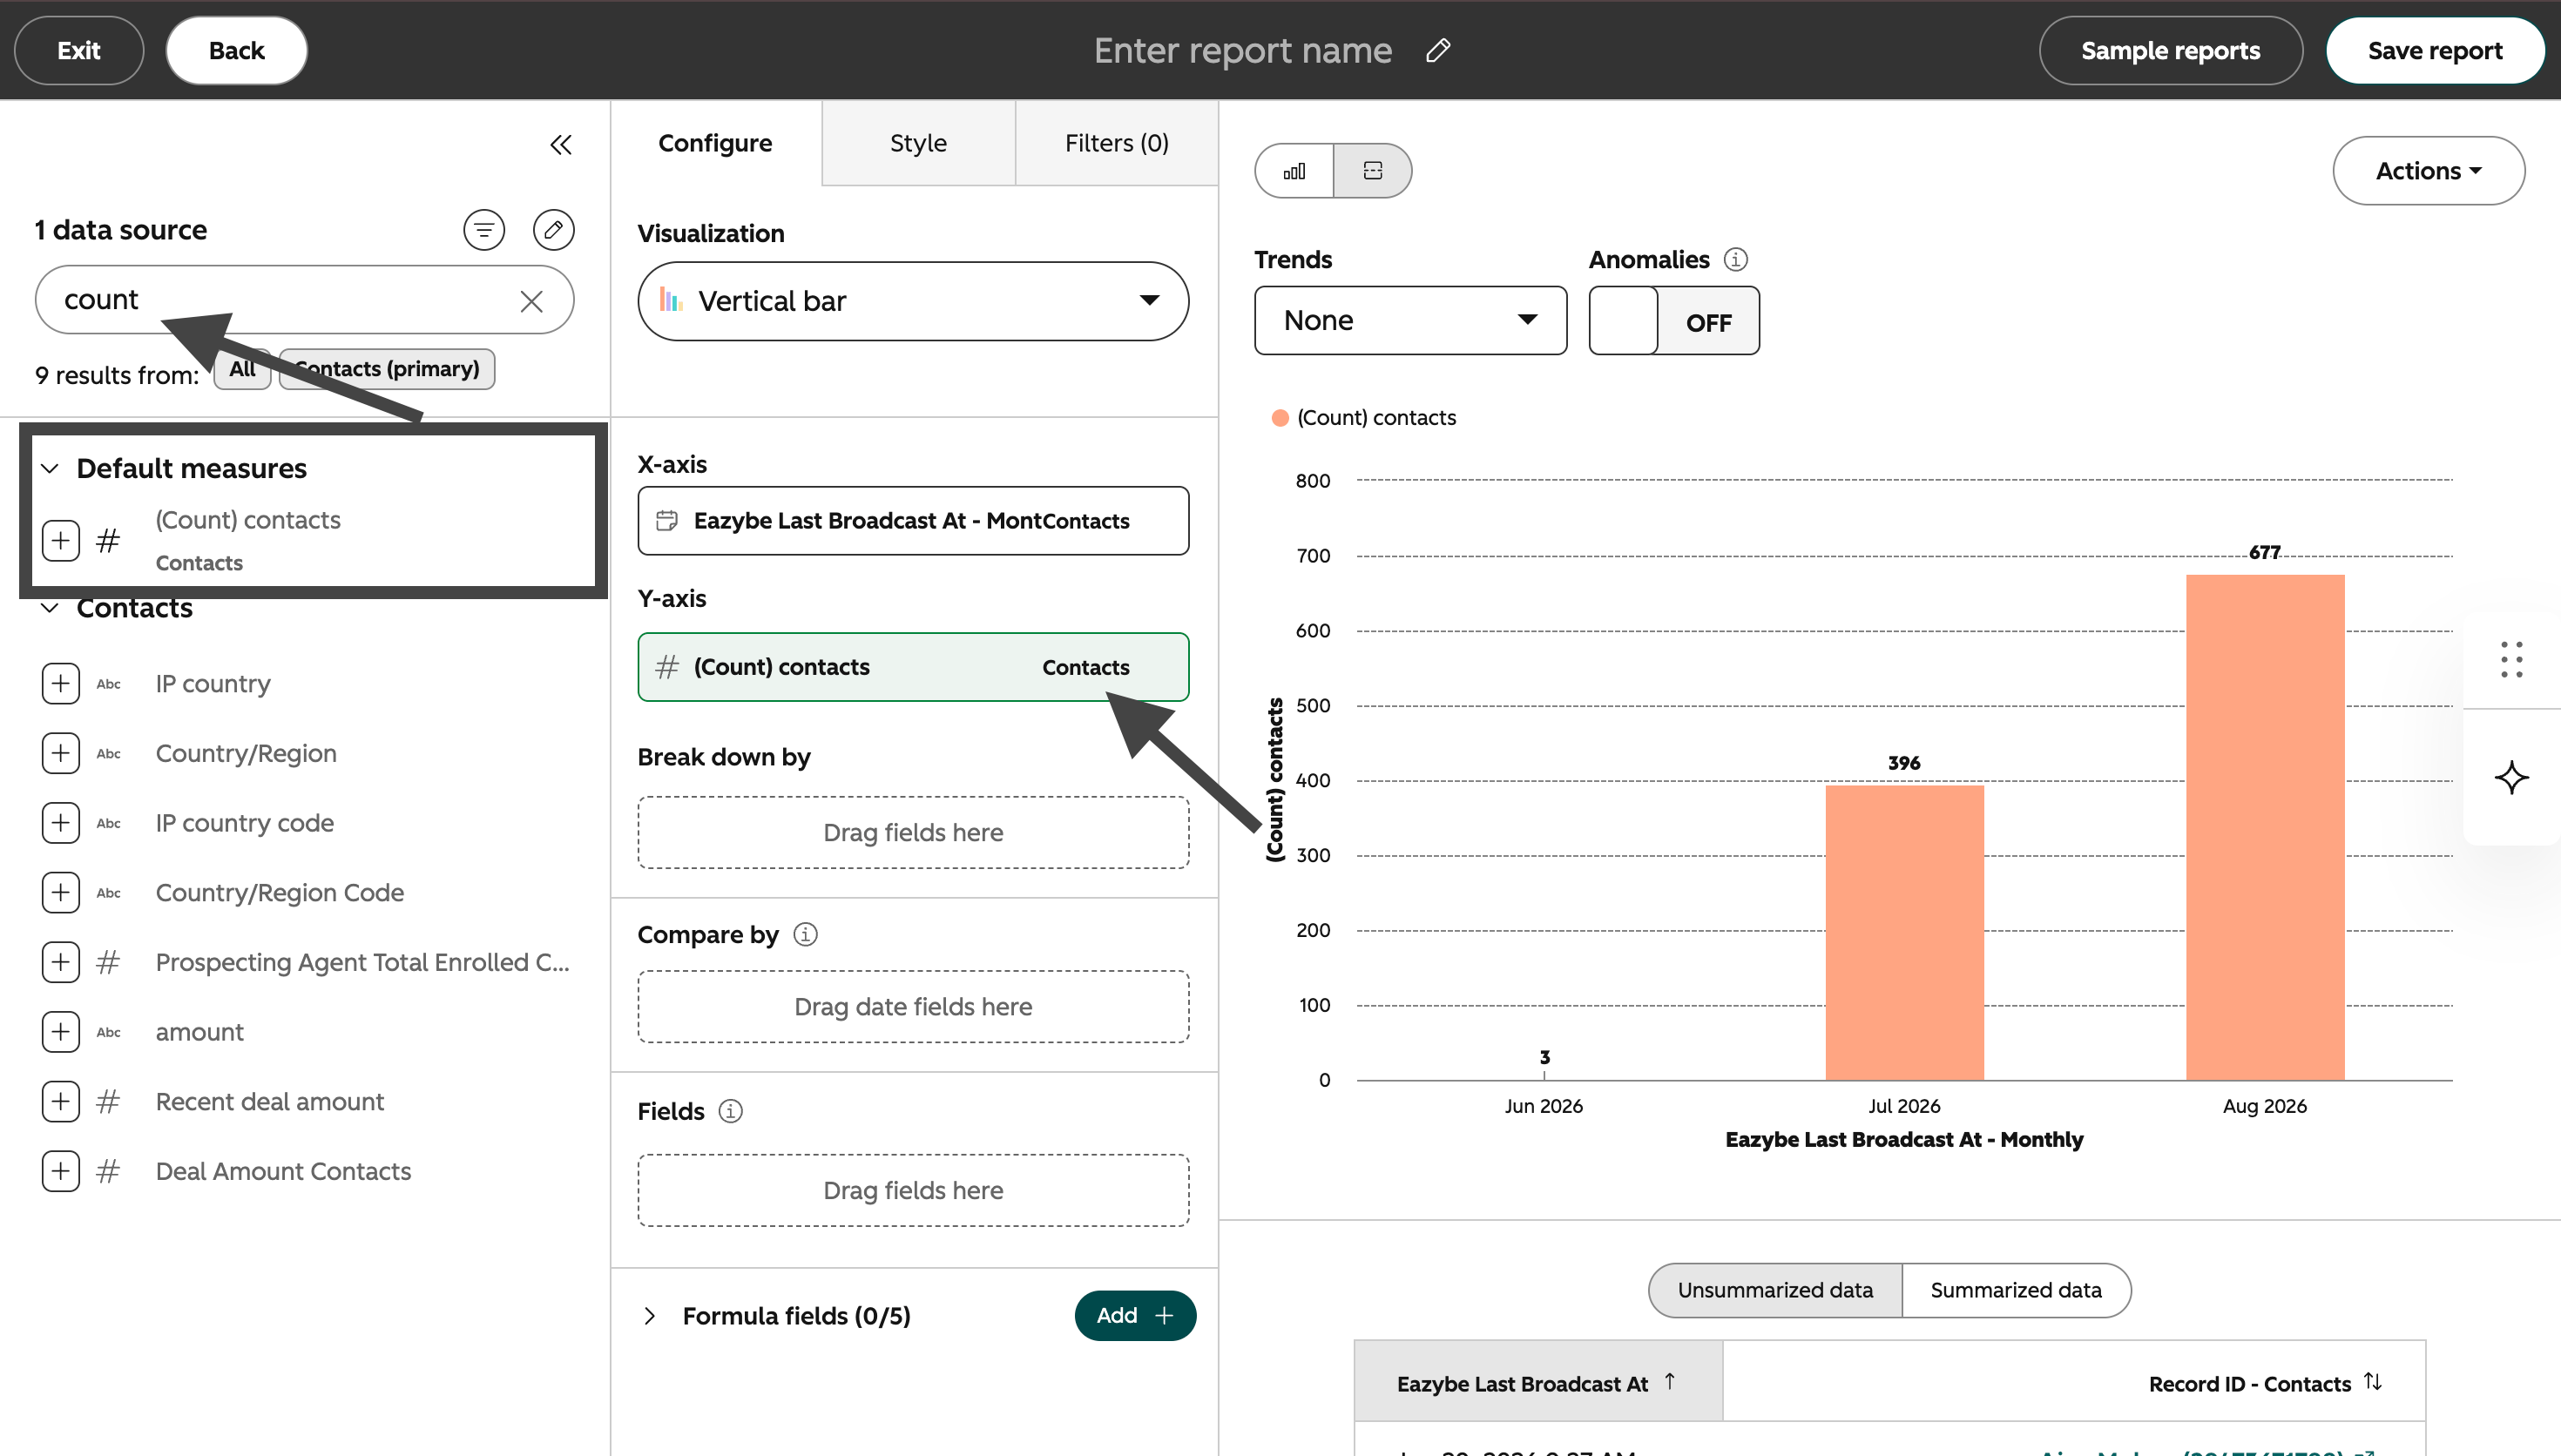
 Search for **Count of contacts** and drag it to the **Y-axis**.
 Drag **Eazybe Last Broadcast Status** to **Break down by**.
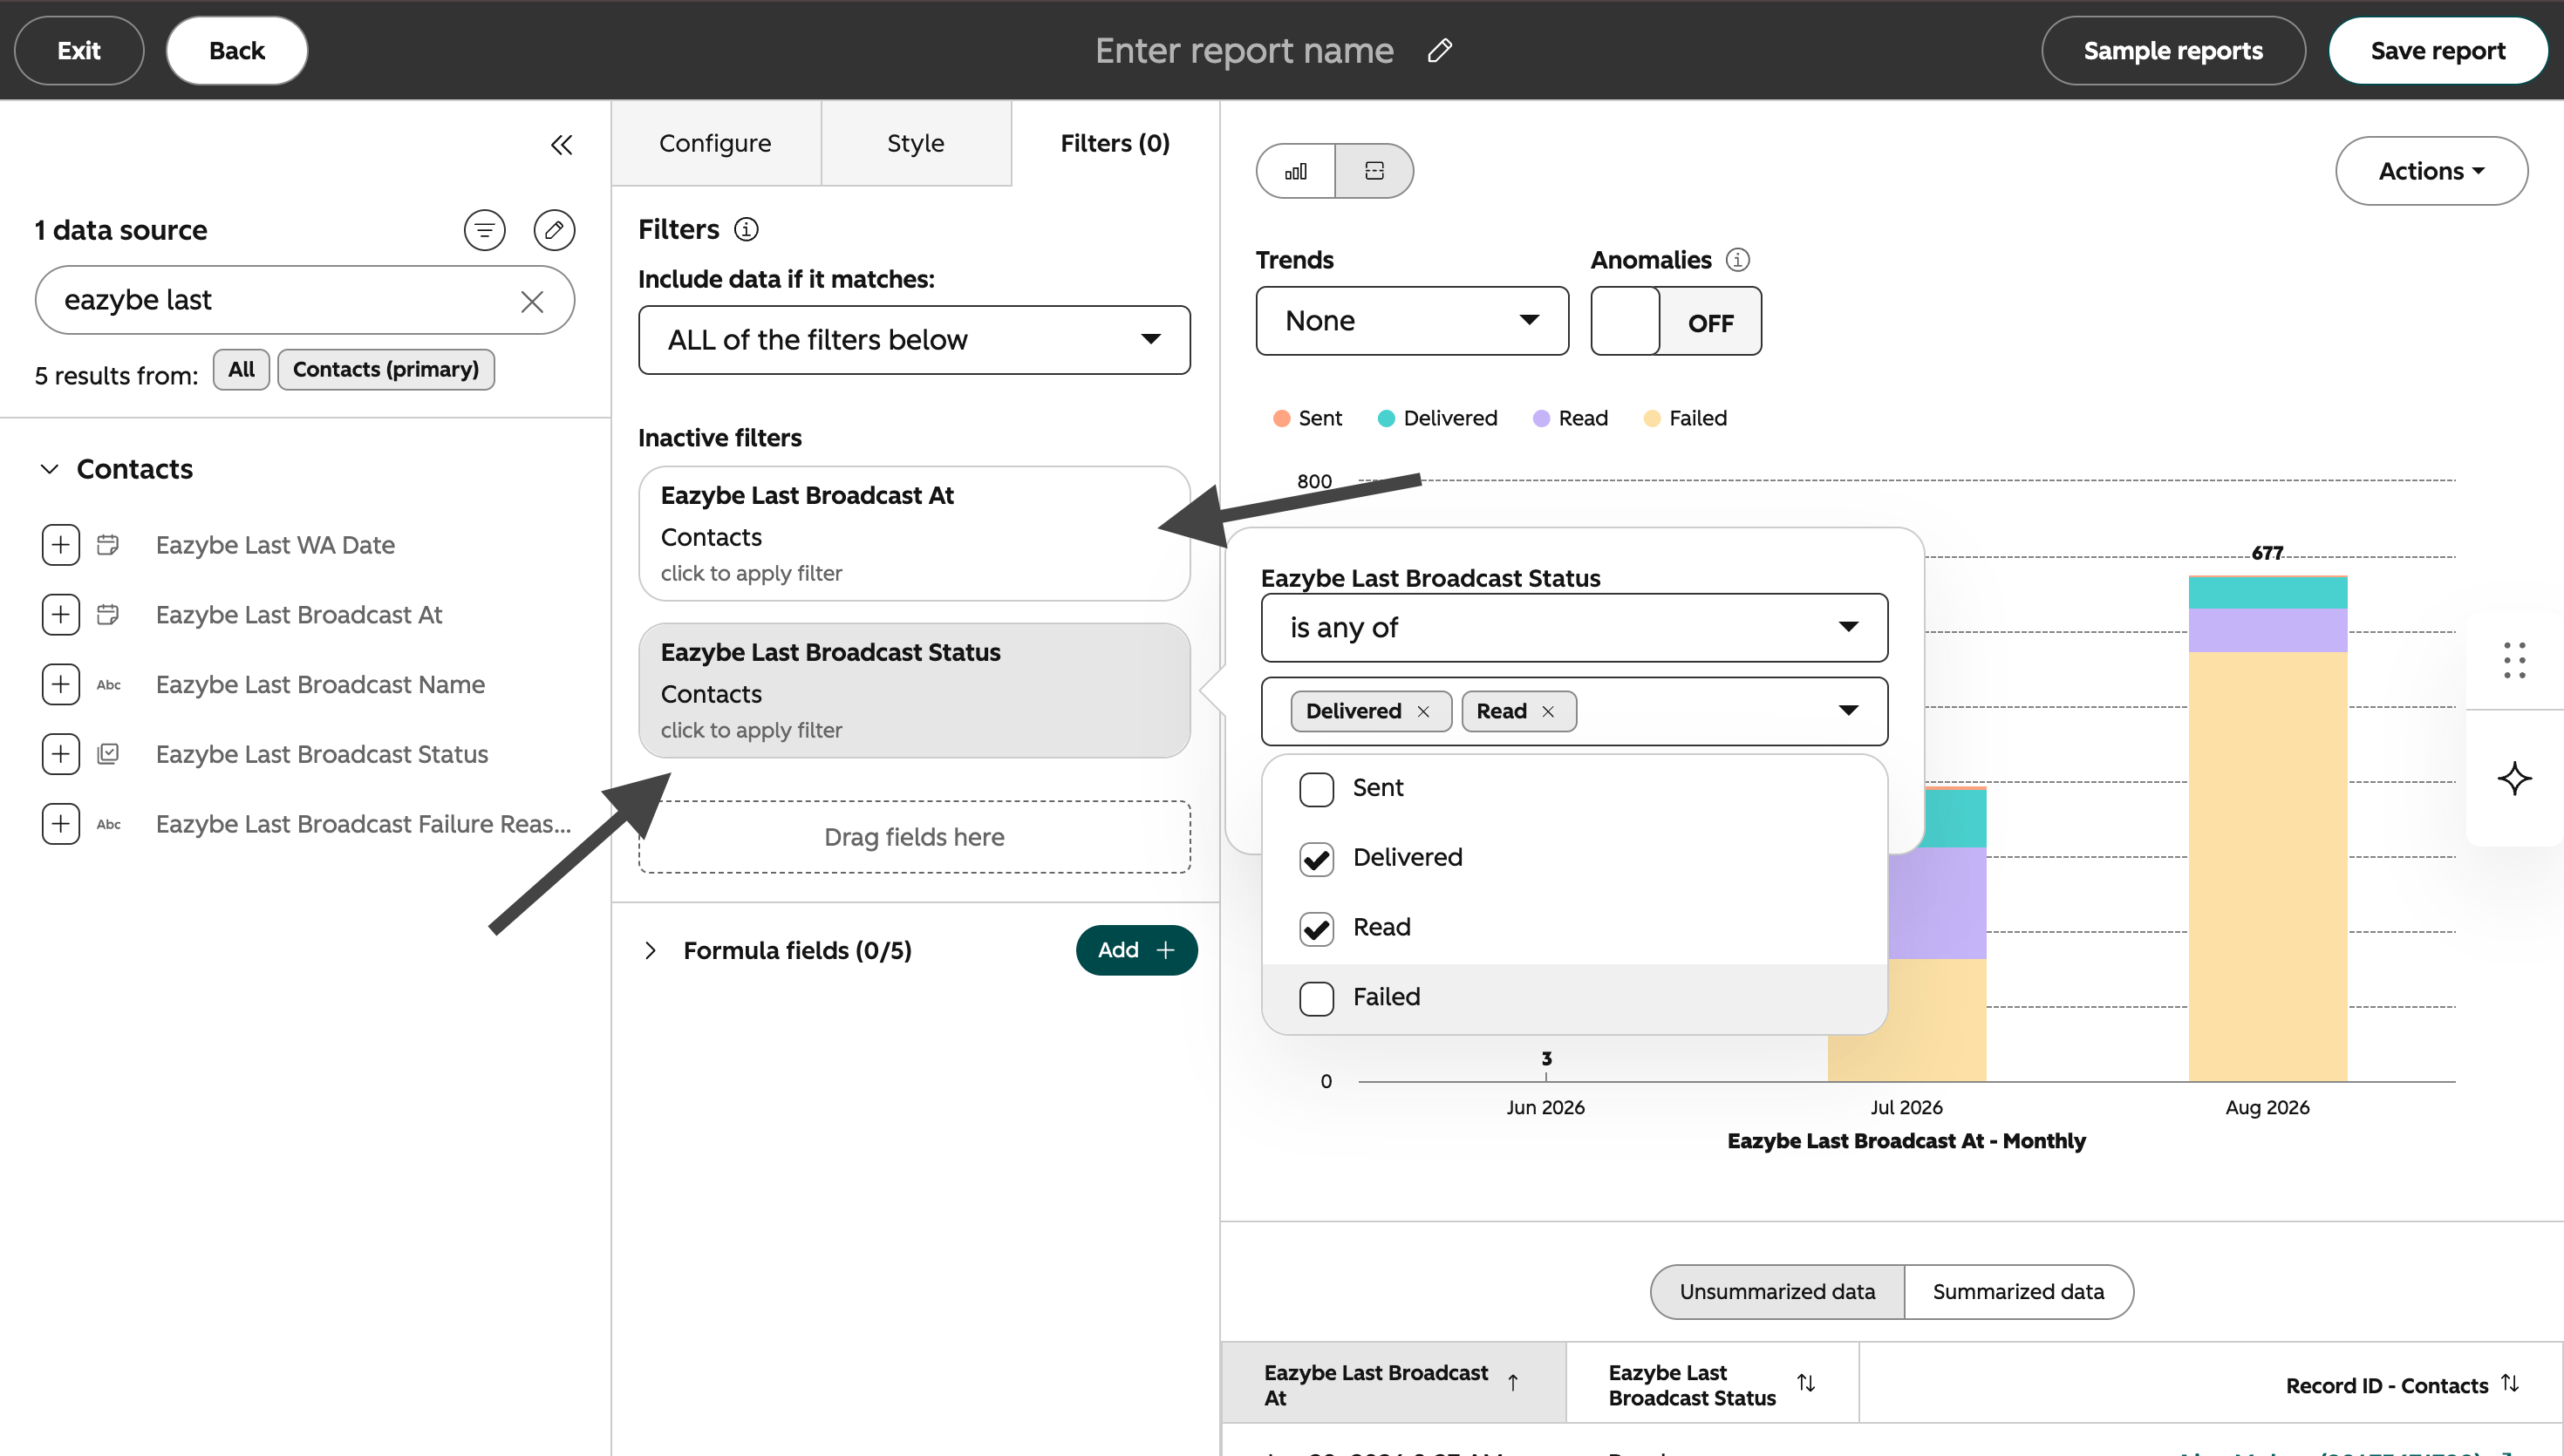
 Open **Filters** and add all of the following:
* **Eazybe Last Broadcast At** is known
* **Eazybe Last Broadcast Status** is any of **Delivered** or **Read**
Open **Filters** and add all of the following:
* **Eazybe Last Broadcast At** is known
* **Eazybe Last Broadcast Status** is any of **Delivered** or **Read**
 Click **Save report** and use the name **Eazybe Broadcast Success by Month**.
 ## Report 2: Broadcast failure reasons by month
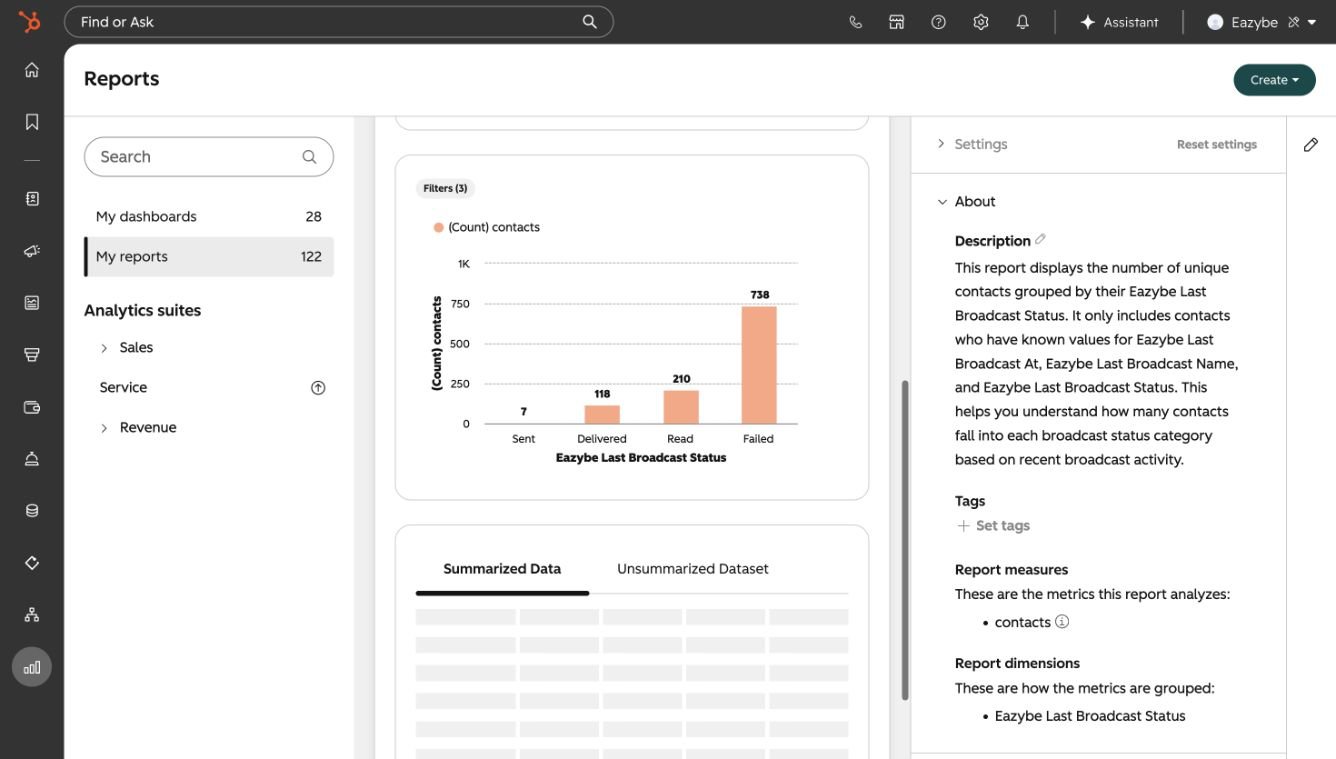
This report shows why broadcasts failed and how frequently each reason occurred.
Return to **Reports**, click **Create**, select **Create report**, choose **Custom report builder**, and use **Contacts** as the primary data source.
Under **Visualization**, select **Vertical bar**.
Drag **Eazybe Last Broadcast At** to the **X-axis**, then set its frequency to **Monthly**.
Drag **Count of contacts** to the **Y-axis**.
Drag **Eazybe Last Broadcast Failure Reason** to **Break down by**.
Open **Filters** and add all of the following:
* **Eazybe Last Broadcast Status** is equal to **Failed**
* **Eazybe Last Broadcast At** is known
* **Eazybe Last Broadcast Failure Reason** is known
Click **Save report** and use the name **Eazybe Broadcast Failure Reasons by Month**.
## Report 3: Complete broadcast report
This report displays all four Eazybe broadcast properties in one client-friendly table.
Return to **Reports**, click **Create**, select **Create report**, choose **Custom report builder**, and use **Contacts** as the primary data source.
Under **Visualization**, select **Table**.
Add these fields to **Columns** in this order:
1. **Eazybe Last Broadcast At**
2. **Eazybe Last Broadcast Name**
3. **Eazybe Last Broadcast Status**
4. **Eazybe Last Broadcast Failure Reason**
Select **Unsummarized data** so each contact's latest broadcast details appear as an individual row.
Open **Filters** and add:
* **Eazybe Last Broadcast At** is known
* **Eazybe Last Broadcast Name** is known
* **Eazybe Last Broadcast Status** is known
Click **Save report** and use the name **Eazybe Complete Broadcast Report**.
If the report displays no data, confirm that **Count of contacts** is on the Y-axis for chart reports and that the selected contacts have values in the Eazybe properties.
## Add the reports to a dashboard
When saving each report, select an existing dashboard or create a new dashboard named **Eazybe Broadcast Performance**. Add all three reports so clients can review success trends, failure reasons, and complete broadcast details from one place.
## Report 2: Broadcast failure reasons by month
This report shows why broadcasts failed and how frequently each reason occurred.
Return to **Reports**, click **Create**, select **Create report**, choose **Custom report builder**, and use **Contacts** as the primary data source.
Under **Visualization**, select **Vertical bar**.
Drag **Eazybe Last Broadcast At** to the **X-axis**, then set its frequency to **Monthly**.
Drag **Count of contacts** to the **Y-axis**.
Drag **Eazybe Last Broadcast Failure Reason** to **Break down by**.
Open **Filters** and add all of the following:
* **Eazybe Last Broadcast Status** is equal to **Failed**
* **Eazybe Last Broadcast At** is known
* **Eazybe Last Broadcast Failure Reason** is known
Click **Save report** and use the name **Eazybe Broadcast Failure Reasons by Month**.
## Report 3: Complete broadcast report
This report displays all four Eazybe broadcast properties in one client-friendly table.
Return to **Reports**, click **Create**, select **Create report**, choose **Custom report builder**, and use **Contacts** as the primary data source.
Under **Visualization**, select **Table**.
Add these fields to **Columns** in this order:
1. **Eazybe Last Broadcast At**
2. **Eazybe Last Broadcast Name**
3. **Eazybe Last Broadcast Status**
4. **Eazybe Last Broadcast Failure Reason**
Select **Unsummarized data** so each contact's latest broadcast details appear as an individual row.
Open **Filters** and add:
* **Eazybe Last Broadcast At** is known
* **Eazybe Last Broadcast Name** is known
* **Eazybe Last Broadcast Status** is known
Click **Save report** and use the name **Eazybe Complete Broadcast Report**.
If the report displays no data, confirm that **Count of contacts** is on the Y-axis for chart reports and that the selected contacts have values in the Eazybe properties.
## Add the reports to a dashboard
When saving each report, select an existing dashboard or create a new dashboard named **Eazybe Broadcast Performance**. Add all three reports so clients can review success trends, failure reasons, and complete broadcast details from one place.